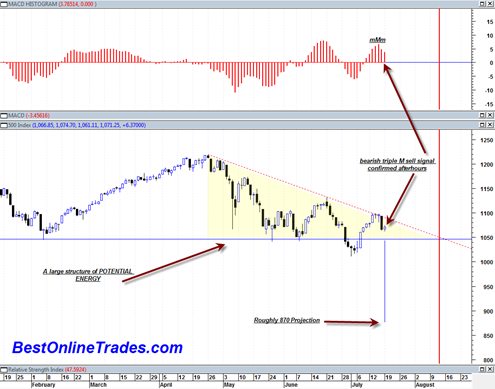
I have to say still at this point that the market character is still decidedly bearish looking. We have been making a series of lower topping formations (in the form of tower tops) that are meeting an ever present horizontal demand line. I have no clue who the buyer is at the horizontal demand line, but it looks like they are about to be overtaken quite soon.
The current structure of the entire market as represented by the sp500 since end of April has now shown a very clear descending triangle. Perhaps this is one of the most under rated patterns out there in the technical analysis field. I rarely see much discussion of it. But that is actually a good thing. I would rather not have the whole world discussing it as it would then probably fail. The mainstream financial media both online and offline seem to mostly recognize the head and shoulders patterns. Perhaps that is why they are failing more often now than in the past. At least it seems that way.
But anyway, this descending triangle has a rough measurement towards the 870 level. A lot of energy has been built up in this structure and it should lead to a big one day move. But as is typically the case, there are likely to be a lot of big individual swings that mark the entire decline. This market has had a pattern of making very large swing trading ranges and I don’t see any reason why it should stop now even if we do get a big one day move down.
A descending triangle is still a pattern that can fail and if it does it would squeeze up through the downsloping line that marks the top of the pattern. This looks very unlikely now though given the recently confirmed MACD histogram sell signal.
There was some bearish earnings news afterhours today that currently put the market in a confirmed MACD Histogram sell signal. The confirmation was a close below last Friday’s low and this currently looks like it is achieved afterhours today. But of course there is always pre market tomorrow and then a ton of new earnings reports tomorrow end of day. Either way, for now it looks like a confirmed sell signal will be achieved.
Today’s action was just a doji and a pause in the downtrend that started last Friday. Perhaps we get another move tomorrow that equals last Friday’s move and keeps the downward momentum strong.
T Minus 16 to 18 Trading Days
So it looks like we have about 16 to 18 trading days before until the August 10 to 12th time frame. The way the whole chart is setup suggests that this Aug. 10-12 time frame for a major low is going to be valid.
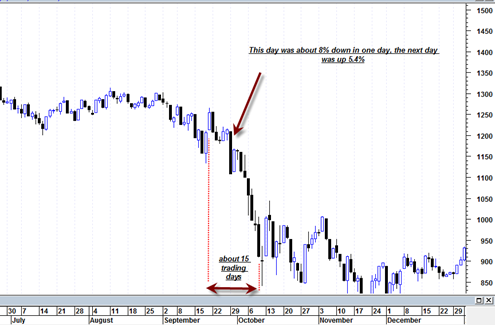
I think the first clue that we have ‘engaged’ on the hard down cycle is maybe a 5% to 8% down day. That would then likely be followed by a huge up day and then a resumption of the downtrend after that. It would essentially be like standing on a diving board trying to catapult momentum. You slowly start to jump up and down on the diving board both up and down until you reach maximum catapult force for the eventual launch off the diving board. I suspect that will be the pattern this time around.
If you look at the 2008 period where the epicenter of the panic cycle occurred there were several big hard down days that kicked off the panic cycle. Then some reaction up moves and eventual persistent down move to finish off the decline in October 2008.
It is going to be very interesting to see how this all plays out.
If 1040 is broken down through very significantly with a 5% to 8% down day then this time it should serve as a very strong resistance level if any upside reactions were to develop. So the 1040 should transfer from strong support into strong resistance.
Be prepared to buckle up. We could be in for quite a wild ride. And we may be in for a very strong period of unusually high volatility where it can be very hard to time the individual swings. From current levels I am thinking that a position short trade right into the August 10 to 12 time frame may be the easiest strategy. But mentally of course it would be very confusing because the market will probably do a good job of tricking everyone into thinking a solid bottom is in before it actually is.


Tom
Thank you for your posting. Fingers crossed here.