Back to the basics again. The monthly basics. I do short posts like this one just as a reality check. It is very easy to get absorbed into the day by day action and the near term fear.
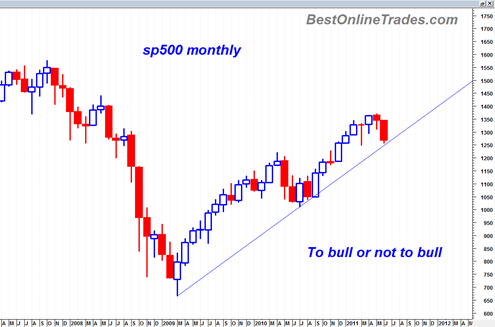
But the monthly chart of the sp500 right now since 3/2009 is still in an uptrend and still supported by an uptrend. So, technically speaking I think we have to sit back and still say that as of today the sp500 is still in a mini bull market.
Of course that could change next month or the month thereafter. But as of this point in time the bull trend is holding. It is simple point but an important one. One that quite frankly I often forget to remind myself of. It just goes to show how important it is to refresh the longer term time frames when it seems like the market is about to fall in a black hole.
The current June monthly candlestick is showing a test of the mini bull up trend line.
One of two things is going to happen for the second half of June 2011.
- A. We will start to see a monthly June candlestick bottoming tail be created.
- B. We will see a violation of the bull trend line.
Then for July, if the mini bull is still alive, then we should see price move higher than todays current sp500 price and start to evolve up along the up trend line again.

