Nasdaq QQQ Blasts Higher today on Robust Volume

qqqq20090812

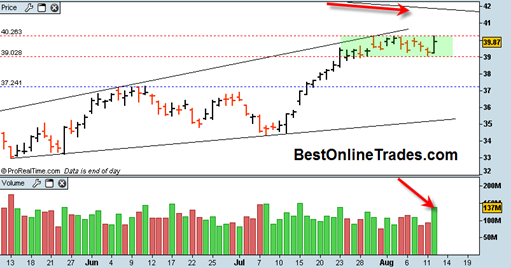
The move today in the QQQ was pretty impressive.  It was impressive in the sense that the bears should have been able to break under the green shaded rectangle and get the much awaited correction going, but the exact opposite ended up happening.  The upside volume was 137 million shares and is a solid way to get a bounce going inside that rectangle. 

This rectangle is depicting internal market strength once again to me and hinting at an eventual possible breakout above this rectangle to towards the 41.5 level which is right at the point of the long term bear market resistance line.  Perhaps we get a retracement the next could of days and then a breakout out of this rectangle next week sometime?

It is almost mind boggling that we are getting this strong price advance and this robust volume at this point in August.  It would seem that traders are in no mood to hit the beach this year.  They would rather be in front of their computer screens. Hmm.

Read more

CORS Corus Bankshares Could Get a Big Upside Pop Soon

cors20090812

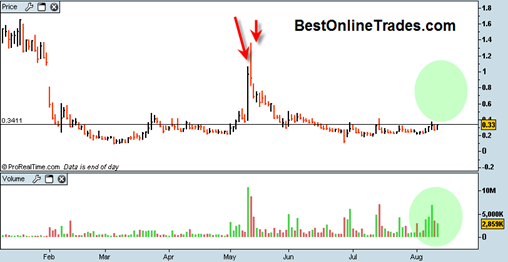
CORS is an extremely risky type of play.  But without risk, then how do you get reward?  Anyway, I think this bank stock could possibly get a big pop soon, maybe even within the next 2 days.  There is a huge short position and to be sure there are all kinds of trading games going on with CORS.

But I do like the recent much heavier than normal 5 day advancing volume, but admittedly without too much price follow through.  CORS has been flat for about a month and a half and it is perched right under a longer term resistance level.

Read more

Gold Market versus US Dollar Battle Update

glduup

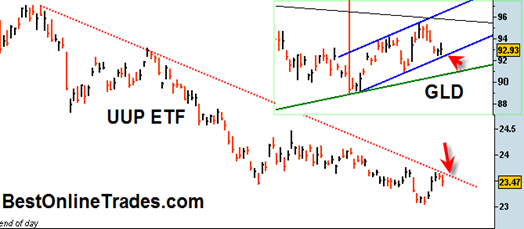
Today was a pretty wild day in the gold market.  Gold was up pretty good going into the FOMC meeting, then it sold off hard right on the FOMC decision and the US Dollar as represented by the the UUP ETF started rallying big time and was starting to create a very bullish looking hammer with price moving to the top of the bar.

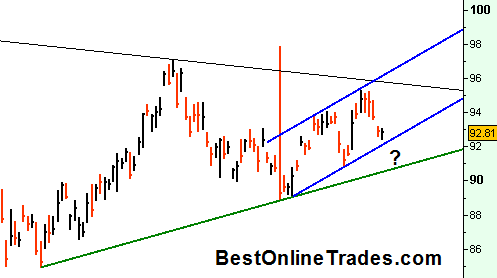
By end of day, gold as represented by the GLD ETF was able to get some footing and settle for a mid range close.  The UUP also got a mid range close.  It is nice to see that the GLD ETF got a little bit of bounce going on the blue channel line I had mentioned several times before.  But it is still too close to call on whether the channel support holds for the GLD.  Perhaps the next two trading days will tell the tale.

I would absolutely love to see the GLD ETF hold this blue channel line and get a move going back UP again and towards the top portion of the channel.  That would be exciting because it could imply another possible (and maybe final ?) breakout attempt of the top portion of the symmetrical triangle.

Read more

CTIC Cell Therapeutics May Start a Run Soon

ctic20090812

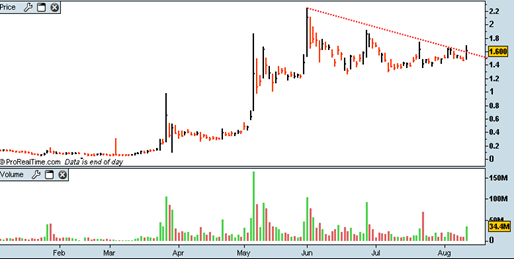
It is quite amazing that CTIC has had such a huge run from a beginning price of about .05 cents.  It has been an astounding run.  I was not smart enough to highlight it at .05, but that is a mute point now.  The fact is that CTIC has shown a huge sign of strength in the run from .05 to slightly above 2.00. 

But if you look at the chart carefully, you can see that CTIC has a certain trading personality and unique trading style that is important to take note of.

Read more

ETFC ETrade Rising back from the Dead

etfc20090812

Etrade Financial looks like it wants to come alive again.  If ETFC can get a move going above 1.52 and above that short term white down trendline I think we may see ETFC make a run for the 2.00 range later on this month.  I have been going back and forth on ETFC.  I indicated in my previous article that ETFC was not worthy of consideration anymore because it broke out of pattern on heavy volume and that the setup if any was confusing.

But if you look at the mini chart above you can see that ETFC has clearly held support of the 1.34 area, and that level of support is pretty solid.  So we bounce off that level today and are making a slow motion run back to the top of the range.  But ETFC still needs to overcome the shorter term resistance and get a move going above 1.52 for me to become even more encouraged.

If ETFC was to enter a more bearish scenario then ‘they’ should have been able to take 1.34 out readily the last few days, but ‘they’ didn’t … So now we are back topside again and maybe a new setup is developing here.

I have no clue how ETFC will close today and whether the FOMC news today will either ruin or enhance the run today.  A lot of times when I have seen the market up big ahead of the FOMC it seems like it has usually been a case of buy the rumor and then sell the news.  So I would not be at all surprised to the the broad market only up a couple points by end of day.

But let’s see how well ETFC can hold up today. 

Read more

SRSR Sarissa Resources Gets Automatic Rally

srsr20090811

You remember in a previous post ( you can see it in the related posts section at the bottom of this post) I was talking about how I believed SRSR would likely get an ‘automatic rally’ ?

Over the course of the last 4 trading days that is exactly what happened.

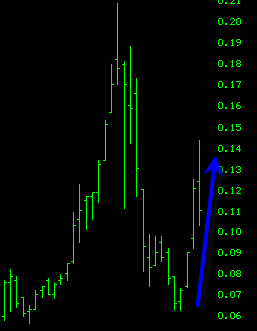
In my previous post I was trying to figure out whether or not .081 was to be the final low or not.  I guessed that it would be.  As it turns out .081 was not the final low.  SRSR went into the low .06’s which was a more solid area of support before the automatic rally.

The automatic rally shot up over 100% from the lows and displayed in true fashion how amazing this type of setup can be.  The hard part is figuring out where the final low is.  But even if you had entered at .081, there was still a sizable profit to be had, but it would have required a draw down all the way to .062 before resuming higher.

So it is somewhat dangerous to play these automatic rallies but they are powerful in the aspect that there is tremendous volatility.  The best automatic rallies I have seen are the ones that occur after a massive price collapse from a very strong and long uptrending arcing blow off type uptrend that peaks into a climax.

Read more

SP500 about to get a Bullish Monthly MACD Buy Signal

sp50020090811

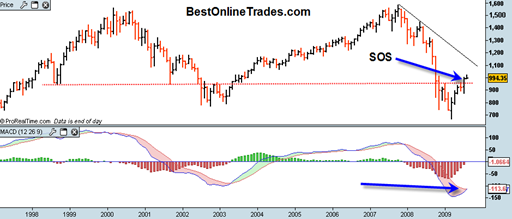
The SP500 is about to get a bullish monthly crossover on the MACD indicator, a popular moving average combination indicator that can become very useful over longer time frames.  The monthly MACD signals can signify new major bull or bear market moves with sometimes 1 year or more duration.

The current daily MACD signal is starting to flash some near term sell signals and could set us up for a move to test the 940-945 range on the SP500. 

It is confusing sometimes when you have a sell signal on one time frame and a buy signal on a different time frame.  To help clear the confusion, I always keep in mind that the longer term time frames have precedence over the shorter ones.  So while we could get some selling pressure into 940-945, we must remember that the longer term signal is indicating higher prices.

Read more

The Gold Market Battle Continues

gld20090811

The GLD today barely did anything but is still inside this blue trending channel which I talked about previously being important for a ‘breakout by September 10th’ scenario.  The volume today was really light on the GLD and it looks to me like the success or failure of the retest of the bottom of the blue channel line could occur tomorrow.

If we break under the blue channel line then it is going to open the door to another retest of the bottom of the symmetrical triangle (the green line).  If that happens it will be critical to hold the bottom of that triangle for an eventual breakout later in September or the final quarter of this year.

I would like to see the US Dollar break down tomorrow and see gold jump right back topside to make another attack on the top portion of the triangle.  But what I wish for and what happens are two entirely different things.  The US Dollar still looks like it wants to pop to the upside as a resolution to its bullish divergence.  But maybe something out of tomorrows FOMC will change that outcome? 

Read more

ANDS Anady’s Pharmaceuticals Possible Breakout Setup

ands20090811

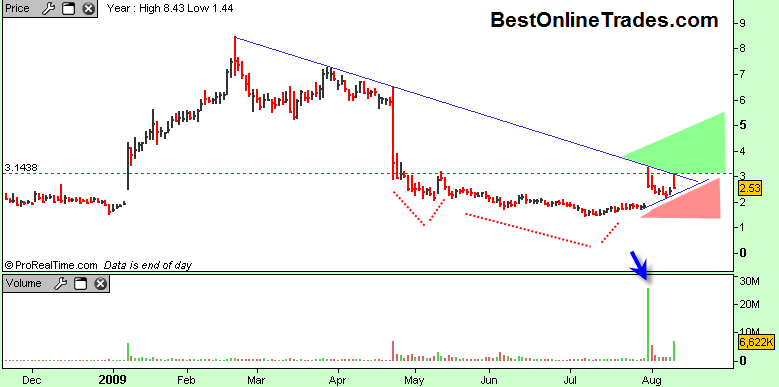
ANDS has had a couple recent big price moves to the upside, and the overall price structure is suggesting to me that ANDS could be setting up for a breakout.

After a brief strong run in the beginning of this year, ANDS went into a somewhat relentless decline to roughly 1.50.  It then had a pop up to the 3.00 range on blockbuster volume.  That pop was sold off intra day and today’s upside pop was also sold off intra day.  However the overall structure of ANDS has some notable and constructive aspects to it.

Although somewhat messy looking there appears to be a head and shoulders bottom formation with neckline resistance at 3.14.  The left shoulder was around 1st May, the head from mid May to end of July and the right shoulder the last 6 trading days.  If I am correct in identifying this head and shoulders bottom, then we could eventually see 4.50 as a target.

Read more