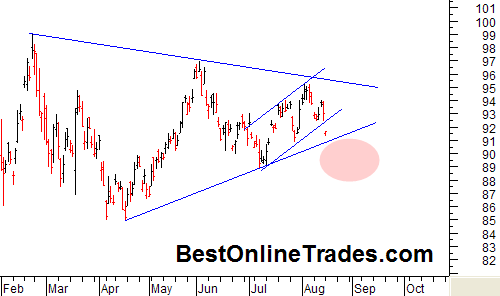
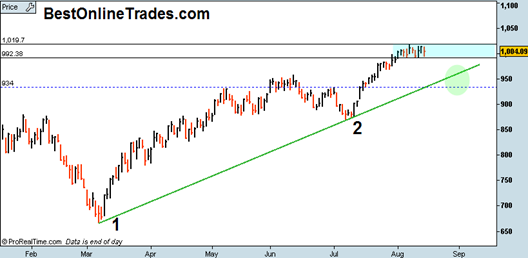
The gold market chips are on the table and the US Dollar chips are on the table, now lets roll…
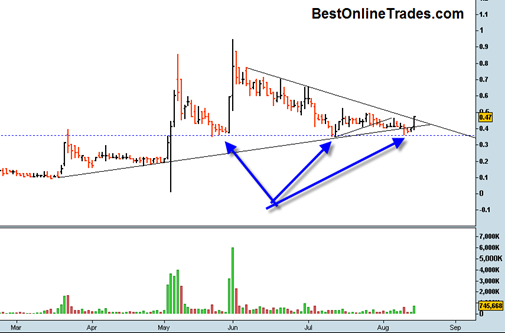
The gold price has now touched the top portion of the symmetrical triangle 3 times and the bottom portion 3 times. One way or the other we will get a resolution. Time wise I have calculated that the gold price cannot really extend much farther then end of September to make a decision because there is simply no room left inside the triangle.
The thoughts that go through my head when I look at the gold price triangle are something like, “Can this market really get an upside breakout?”, “What if the gold price extends too far into the apex?”, “This chart better start resolving itself SOON”.
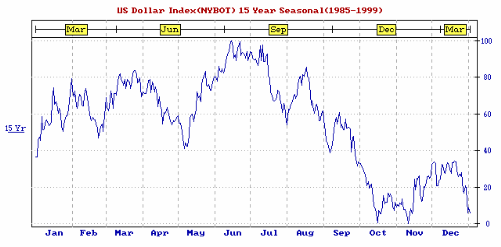
The chart above is the seasonal US Dollar chart between the years 1985 and 1999 courtesy the Moore Research Center. What is interesting about this seasonal chart is that we can see that the US Dollar tends to have a lousy second half of the year statistically between years 1985 and 1999. And if we look carefully at the chart we can see that the most devastating statistical downside for the US dollar starts at MID AUGUST (we are in mid August 2009 right now) and then continues almost relentlessly until mid October.


