C Citigroup has an Outstanding Bullish Setup

citigroup20090820

It seems I have spent so much time focusing on a lot of really cheap and speculative stocks here at BestOnlineTrades that I haven’t been able to see the forest for the trees.  Well I saw the whole forest today and Citigroup jumped right out at me.

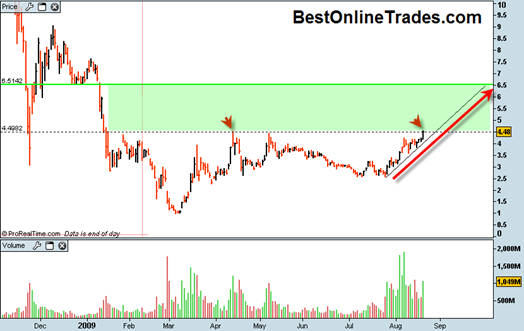
Citigroup looks like a really good setup to me right now.  Even though it has already rallied the last few weeks we have closed on August 20th right at the previous resistance line.  The volume comparison between the two swings noted by the red arrows shows a decline of about 13%.  That may be a sign that we get a minor pull back tomorrow, but I think Citigroup is going to bust out topside from this 4.50 resistance level and head on towards the 6 to 6.50 range perhaps during the next few weeks.

Read more

ANDS Anadys Pharmaceuticals Compressing Into a Tight Range

ands20080820

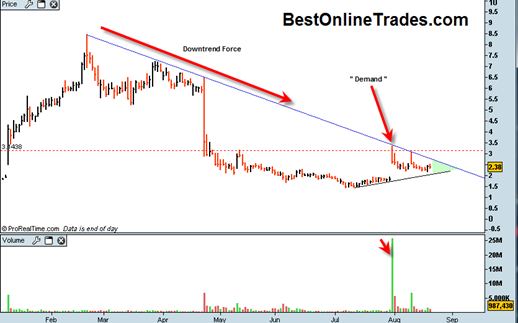
Here is another quick mention of ANDS.  I still think something interesting could potentially be developing here on the upside eventually.  ANDS is not ‘timely’ now because it probably still wants to fill into that green shaded area on the chart above.  But it may become ‘timely’ if it can get an upside break and hold above 2.70 in the weeks ahead.

I just like the fact that ANDS near the beginning of August was able to do a massive body blow on huge all time record volume to the 3 and change red dotted resistance line.  That price swing also tested quite a few previous swings and exceeded their volume by factors of 5 to 10.

Read more

GLD Declines Today but on Lowest Daily Volume since Christmas 2008

gldgoogle

The GLD was down slightly today but the volume was the lowest volume we have seen on the GLD since Christmas 2008.  The volume today was 3.97 million shares.  For the GLD this is the equivalent of holiday trading volume.

This is significant to me for a couple of reasons.

One of them is that it confirms the fact that we are right inside the apex of this large symmetrical triangle on the GLD since February 20th, 2009.  Volume declines into the formation of a symmetrical triangle is expected.  During the entire formation of the triangle, the bulls try to rally price higher and then the bears slam price lower in successive steps each slightly higher and then lower as the pattern progresses.  It is a frustrating pattern because it seems that no significant progress is being made either up or down.

But progress is being made in the sense that significant cause building (energy) has occurred which will eventually see a resolution.  My bias has been for an upward resolution out of this pattern.

Read more

CTIC Cell Therapeutics Near Term Uptrend Remains Intact

ctic20090820

CTIC pulled back today and volume declined by roughly 50% compared to yesterday.

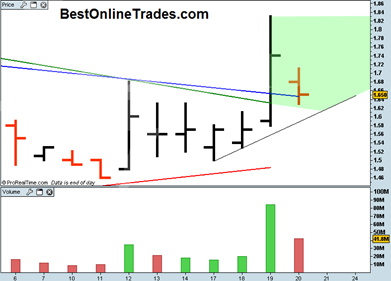
It closed above the former blue downtrend that that was pierced yesterday which is a short term positive sign.

Tomorrow I really prefer to see CTIC close above 1.64 or higher and to keep an intra day low that is higher than 1.61 .  If CTIC can do that then it will remain in the green shaded area I have drawn on the chart and keep the short term uptrend intact.  This is critical in my opinion for the breakout continuation into next week.  I want to see CTIC stay trading within this green shaded area as a sign that the potential breakout continuation is still in force.

If CTIC is not able to close and hold above 1.62 tomorrow then it will be a concern going into next week in my opinion.  We must not close below 1.62 tomorrow otherwise it may be a short term sign that this breakout continuation is in doubt for next week.  I like to see stocks PROVE themselves and I really do not have much patience for lack of performance because a lot of the time it can lead to big problems later on. 

Read more

Four Words Today Gold Up Dollar Down

The US Dollar got clobbered today and gold popped up like a basketball submerged under water.  So far the supposed US Dollar rally is not materializing.  The dollar is trying to rally but it cannot seem to get any real ease of movement to the upside.  It still could, but it had better start soon because it is once again flirting with the critical longer term support line.  The price action today in the dollar looked like a real sign of weakness to me.

Meanwhile the gold price is inching closer and closer to the completion of its symmetrical triangle formation and I am slowly gaining more and more confidence that we are going to see a real breakout from this market come beginning of September.

The dollar index just keeps failing to get a rally going and I am thinking if it keeps failing like this for the rest of August it might turn into a real severe drop in September.  If that scenario plays out then it would help the gold price to finally get an upside breakout above the 1000 range.

Incidentally, if I am correct that we do get a gold price breakout, it will be important that the breakout materializes in the form of wide price spread and blockbuster volume on the upside.  We will have to take a look at the GLD ETF to get confirmation.

I still think this gold price setup has the  potential to be one of the greatest upside setups I have ever seen in my life if I am correct on us getting an upside break.  

21.70 on the DGP ETF ( The gold double long ETF ) is for me the green light signal that the breakout has started to initiate.  The “safer” upside trigger on the DGP ETF is 23.75 or above.

Read more

CTIC Cell Therapeutics Breaks Out on Substantial Volume

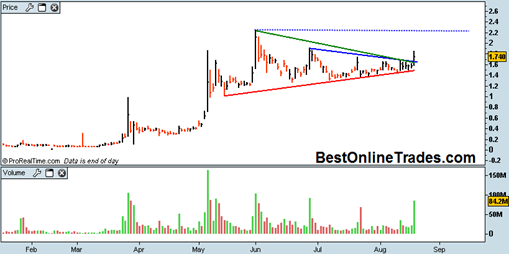
CTIC had a nice confirmed breakout move with confirmed volume and sign of strength above the down trend resistance lines of its larger triangle formation today.  This is part 3b in a multipart series on CTIC.  I first started tracking CTIC when it was compressing into the apex of this triangle on August 15th, 2009.

ctic20090819

So far all systems are go on CTIC in my opinion.  The bombshell volume today and wide price spread is exactly what we wanted to see as confirmation of the beginnings of a breakout.  The price of CTIC did retrench at the end of the day but it still achieved a somewhat better than mid range close for the day. Not bad at all.

It appears that the price is starting to move in anticipation of that so called forward looking news event that may or may not occur on August 24th which is upcoming Monday. 

Read more

Spot Silver and Silver Futures Headed for Upside Breakout in September

This monthly chart of the spot silver price is saying that the price of silver and silver futures are going to break out topside in September – October time frame.  The silver price has consolidated into a down slanting head and shoulders bottom formation.  The monthly MACD is about to cross north and price is … Read more

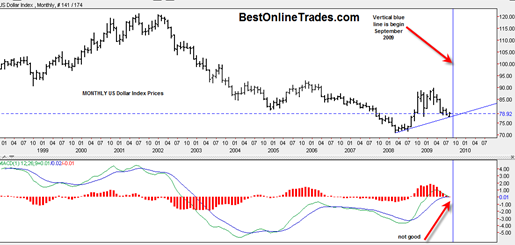
Monthly US Dollar Chart Indicating it May Break Down Severely in September

monthlyusdollarindex

I have some new information on the US Dollar index and wanted to bring it to your attention.  My obsession with the US Dollar Index continues… But why? Why am I so obsessed with the US Dollar Index.  I am because it is either going to help gold do a MEGA breakout or it could potentially hinder any breakout in gold or even cause a break down.

I just wrote a post on the negative seasonals that are kicking in for the US Dollar Index starting right now.  But I only just now discovered a new perspective on the US Dollar Index that is giving me a little extra dose of confidence that we could see the US Dollar break down severely in September and subsequently cause the gold price to spike to a new all time 30 + year high.

Read more