Spot Gold Price Daily Chart Shows a Double Inside Day

gld20090825

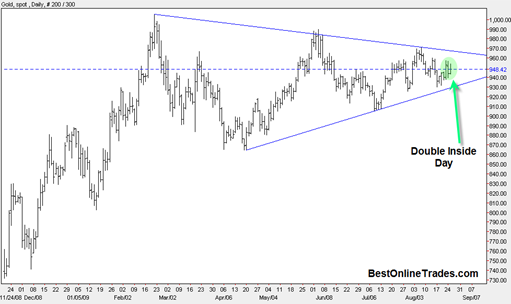
If you ever want to know what it feels like to be bi-polar, all you have to do is start watching the gold price on a daily basis.  Two days ago gold was up big leading one to believe that a breakout may start.  Then the next day the gold price took a major body blow to the downside.  Then today (at least so far) spot gold popped right back up again.

But this ‘bi polar’ type price action is accomplishing something important.  It is filling in the large symmetrical triangle that has formed in the gold price since the mid February 2009 time frame.  This is a large triangle and has a lot of significance in terms of the amount of of energy that is being built up.

Read more

EPEX Edge Petroleum Breaks Out with a Sign of Strength

epex20090824

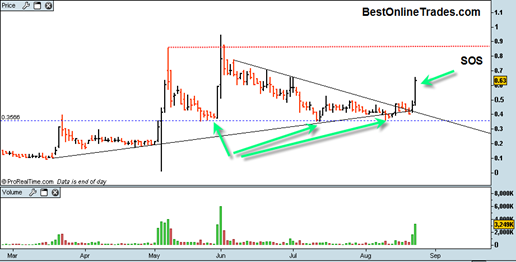
I had mentioned EPEX a few other times casually because I though it had some good potential based on an important volume swing test in early June and early May 2009.

When I first started writing about EPEX I was intrigued by the substantial high volume swing test that occurred on June 1st.  That was a very important clue as to the behavior of this stock because it was telling me that we would have a good chance of revisiting those levels.

But when I first mentioned it on July 28th, 2009, the price was languishing in a somewhat choppy confusing price pattern that seemed like it was going nowhere.  Despite the confusing price action there were still well defined resistance lines and support lines that contained price and gave good parameters to work with.

Read more

S&P500 Index has Possible Short Term Bearish Divergence

spy20090824

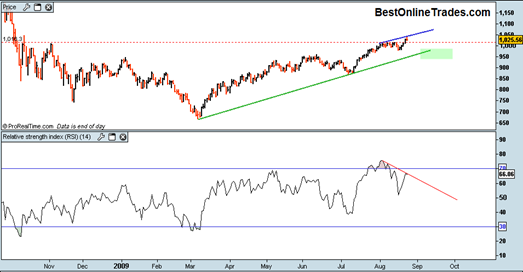
The S&P500 had an intraday reversal today and price closed near the opening price creating a reversal hammer on the candlestick chart.  But perhaps more significant than that the S&P500 created this reversal hammer early in the week and has created a possible short term bearish divergence between the relative strength index and the S&P500 closing price for the month of August.

There are only 5 days left in the month of August not including today and it has me thinking some sort of correction may start here.  The follow through sign that a correction will continue is if the relative strength index fails to make anymore upwards headway and if the SP500 breaks down below minor support near the 1014 level.

Read more

Some Final Comments on CTIC Cell Therapeutics

CTIC20090824

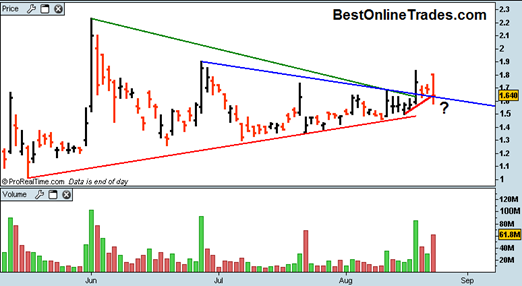
I may do one last follow up on CTIC in the future, but this update will serve as a final commentary for now.  I would like to remain bullish on CTIC and tell you that it is going to do a continuation breakout, but after today’s price action I just cannot bring myself to do it.

You remember in a previous update I mentioned about how CTIC was extending very far into the apex of this symmetrical triangle and how that can sometimes weaken potential breakouts.  Too much energy can sometimes be lost when a stock extends out too far into the apex of a symmetrical triangle.

So it is very possible that we are dealing with a failed breakout here and now a return back into the apex of the triangle.  If that happens then CTIC could be at risk of breaking down even more thereafter.

Read more

Almost Never Hold a Stock or ETF after a Shooting Star Candle or Price Bar

cegeshootingstar

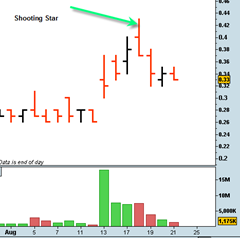
After a stock has had a significant advance it usually never pays in my experience to hold on after you see a price bar reversal that resembles a shooting star candle stick.

There are specific definitions of exactly how a shooting star candle stick should look.  But in my experience, any price bar that shows a large intra day advance above the days previous high and then closes back under that high and near the bottom of the range is a very bearish short term signal for me.

It seems like almost every time I have seen one of these price bars the next day or few days price action has been very weak and down.

Sometimes these reversal bars can lead to really significant price destruction for a long time.  It all depends in what phase of the trading cycle a stock is in.  But regardless of the phase it is in, most of the time it is prudent to bail out and seek safer waters.

Read more

Edge Petroleum Corp EPEX Trying to Breakout North from Rectangle

epex20090821

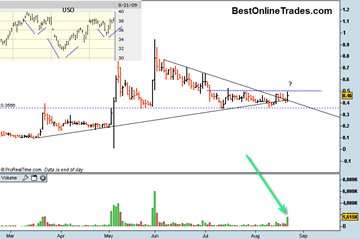
EPEX is trying to get some kind of a breakout move going but so far has been unable to get any kind of confirmation.

On Friday August 21st, it did manage to get another upward advance within the rectangle (defined by the blue horizontal and blue dotted horizontal) and also get a close above the down trend resistance line.  The volume also got a nice surge going today and may be an early sign that EPEX is close to getting above the .50 level.

It needs to get above and hold above .50 for me to start thinking a new uptrend has started.  So far still a no go, but I will take today’s action as a possible early clue.

Also note on the EPEX oil stock chart (click on it for full size) above the top left corner of the chart where I show the USO oil ETF.  It is possible that the USO oil ETF is close to completing a head and shoulders bottom formation.  I would think a northward breakout from that formation would definitely help the cause of EPEX finding a way to get a new uptrend going.

Read more

Gold Market May Achieve 30 year Cup and Handle Breakout Next Three Weeks

TsarCannon

I continue to get more and more bullish on Gold with each passing day.  The only thing constraining a truly rampant bullishness is this large symmetrical triangle you have heard me talk about repeatedly over the last few weeks.

If the GLD ETF can get above 95.25 during the next three weeks and if the DGP Gold Double Long ETF can get above 21.50 during the next three weeks then I am going to have to make the conclusion that the massive 30 year cup and handle breakout is in full force and we should then get a long term upside continuation breakout of between 6 to 12 months duration.

Read more

Citigroup Inc. (NYSE:C) Delivers a Confirmed Volume Breakout

citigroup20090821

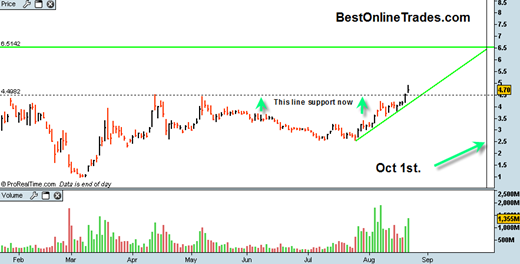
The pressure was on Citigroup to deliver a breakout above the 4.50 level on greater than 1.22 billion shares.  Citigroup delivered handily today with a nice sign of strength breakout on 1.35 billion shares.

Now the 4.50 level becomes new support and there still exists this bright green up trend line which should help support price into the 6 to 6.40 range which I consider to be an ideal target and eventual exit point.

Read more

CTIC Cell Therapeutics Still Holding Above Blue Resistance Line

There is not too much new to say about CTIC today other than the fact that it is still doing what it is supposed to do.  CTIC held above both the original blue longer term resistance line (which is now support) and it also held above the shorter term red minor trendline.  This is important … Read more