Hold Gold Through September

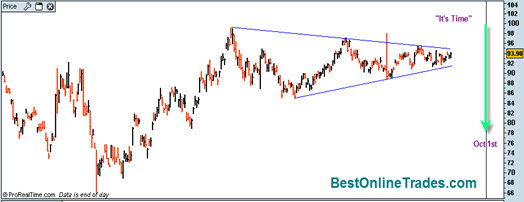
A while back I mentioned how I thought gold was ready for a big move and had a bias towards the bullish side based on longer term charting.  I also mentioned the GLD 100 January Calls which at the time were trading around 4.00 .  Now they are trading near 5.60 or close to 50% higher.

I expect them to trade even higher than that during the month of September.

Most of the time in my opinion options are a bad idea unless you can devote full time to them and maybe even work with professional options trader for cues.  There are just too many ways in which options can go wrong.  And there are too many factors that can go against you, with one of the biggest ones being time decay.

Time decay means your timing has to be spot on otherwise you will keep losing ground in the price of the option the closer you get to expiration.

Anyway, some people like options.  Personally I can’t stand them because I think there are better ways to play the market with similar returns to options but without the hassle of time decay and other factors.

That said, once in a blue moon options can be a worthwhile trade.

The reason I mentioned the GLD 100 January Calls Back on the 3rd of August 2009 was because I felt we were coming into a very unique breakout type scenario in the gold price.  I thought it would happen sooner, but here we are in September 2009 and it appears to be in full force now.

Read more

What I saw In Gold and the SP500 Today

The SP500 closed right near the highs today but the volume was lousy.  I have to say this is a pretty amazing accomplishment given that it is a lazy Friday right before a 3 day holiday weekend.

The gold price also barely pulled back today and managed to close slightly positive on the daily basis.  This is a very bullish sign on a near term basis and says to me that the gold market could get some significant continuation next week.  The longer we hug the recent highs without pulling back that much, the more bullish potential we have for the long awaited break over 1000 !

But there is talk that the broad market is supposed to tank big time next week. I can see this as a possibility when I consider the huge downside volume that we had 3 days ago in a serious sign of weakness.  Yes we bounced higher today and closed right at the highs but it was on barely any volume.  It was all smoke and mirrors.

But I do have to respect the fact that we bounced off of support and now are bouncing back topside.  It just seems like the bears should have been able to accomplish more downside this week but they couldn’t get it done.  If they can’ t get it done next week then it could very well be that we are headed for more super bullish upside prices.  In a previous more longer term post on the sp500 I mentioned a scenario where this could be possible.

If this market is going to get a serious downside correction then I would think we get a gap down on Tuesday in the AM and then just slide down from there.  If we are still drifting around next week, then I am going to become more and more skeptical of the ‘super duper correction’ in September scenario.

Read more

Natural Gas Futures are Plunging and so is the UNG

NGAS20090903

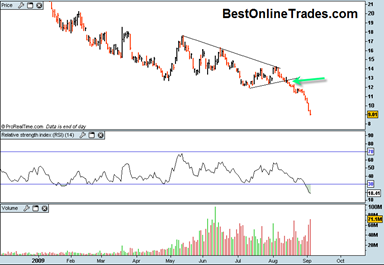
But is there a bottom to be had in Natural Gas yet?

I think it is too early still.  The UNG has shown no signs that it wants to get a reversal going.

However it is clear that with the relative strength index at 18.49 we may be near a possible turning point.  There is also a full moon tomorrow and I have seen many times big reversal occur right on full or new moon days.

A highly speculative short term turn around scenario would be if the UNG gaps down at the open or just simply plunges at the open 10 to 20% bringing the daily RSI value even lower to perhaps 15 and change.  Then after lunch a reversal begins and a full reversal price bar that closes slightly positive.  That could be a first sign that the UNG is ready to start some sort of near term turn around.

But even if it does that, I suspect it will not be able to get an upside run going until at least a small double bottom forms and RSI starts to base out and develop a stance that eventually enables it to cross above the 30 level.

Read more

Spot Gold Does a Nice Upside Continuation Today

spotgold20090903

The spot gold price did a similar move to what occurred yesterday and without much help from the US Dollar.  The dollar continues to linger around and trade flat while gold seems to have a mind of it’s own.

The significant technical event that occurred today (at least in spot gold) was a piercing and close above of the longer term down trend line in force on the spot gold price since March of 2008.  When we look at the GLD ETF, we had similar upside volume to yesterday.  So the longer term bearish down trend line was attacked with a significant volume surge and also pierced.

This is good news for the bullish case.  But what I would most like to see in spot gold is a full price bar above this longer term blue down trendline to show me that we have officially cancelled the bearish trend in existence since March 2008.

Read more

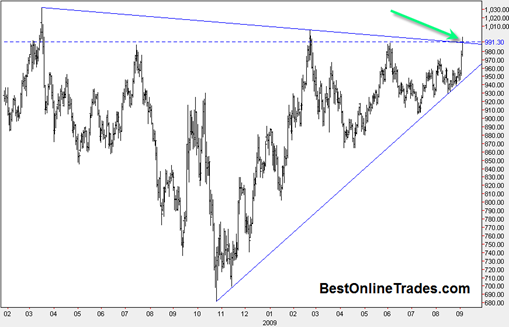
The Gold Price Initiates Breakout from 30 Year Cup and Handle Pattern !

GLD20090902

I am only going to do one post today and it is going to be on the GLD ETF because I want to emphasize how important a day it was today in the gold market.

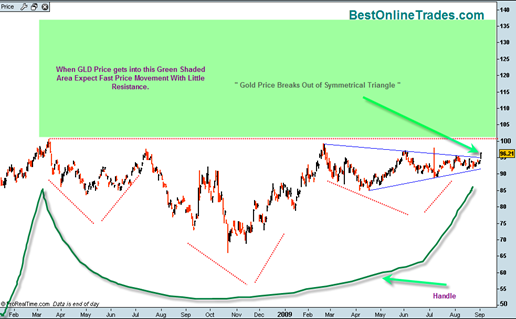
Today we broke out north from the large symmetrical triangle with confirmed volume and confirmed sign of strength.  The triangle formation has been developing since February-March 2009 time frame.  This is quite a large triangle and has significant cause for an extended move.

But there is even better news.  This symmetrical triangle also makes up the right shoulder of the much larger head and shoulders bottom formation that has been in existence since March of 2008.

And there is even more better news.  The entire head and shoulders bottom formation of approximately 1.5 years in duration is in itself the handle of a super large cup and handle formation which is 30 years long.

Read more

ABK Ambac Financial Group May Recover after Market Correction Ends

abk20090901

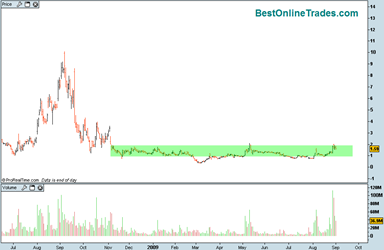
Ambac Financial Group has been trading in a sideways trading range for almost a year and has not managed to break out above the green congestion area shown in the chart (click on it for full size).

It is clear now that the broad market is in a corrective process and that we are likely to see lower prices in the weeks ahead.  How deep and long that correction runs is a mystery to me still at this point. 

I would expect ABK to get some sympathy downside from the broad market decline in the weeks ahead.  But at some point ABK may be setting up for an upside breakout out of this trading range.  The thing I like the most is the huge volume accumulation in the month of August.  It could be an early sign that a major new uptrend is in the works.

Still, ABK is very volatile and needs to work off some of the recent spike it just had. 

Read more

Today was an Absolutely Huge Day for Gold

gldetf20090901

Today was a huge day for gold and the GLD ETF in my opinion!  Gold got a nice bid today and held firm.  I consider it to be a possibly pivotal day for the gold market for two reasons.

The first reason is that despite the broad market break down today, the gold price (as represented by the GLD ETF) held firm all day and managed to trade up by about .60%.  I hinted about this when it happened a few days ago and could be the early signs that foretell a scenario where the gold price becomes less “co dependent” on the broad market for its direction.

The second big reason I consider today to be a pivotal day for the gold price is because gold was able to trade up today despite the significant US dollar strength we saw throughout the day today.  So we had the broad market down big, the US Dollar UP big and the gold price holding firm and managing to get a nice upside close. 

Read more

S&P500 Finally Starts a Real Correction

sp50020090901

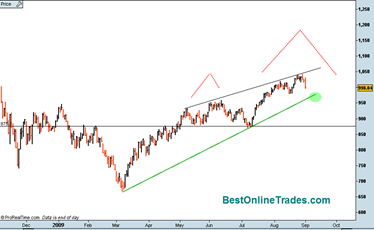
There is no doubt about it, the SP500 finally started a more serious correction today.  It was able to evade this correction for all of August but the shorter term bearish divergence was hinting that some sort of down move was in store.

You can clearly see from the chart that the SP500 is confined by the longer term green up trendline and the top black channel line.  It appears that we want to trade down now and test the bottom of this channel.  It is going to be important for that green up trendline to hold price during the month of September otherwise it could warm of a more involved correction that may see us trade down to the 870 range. 

But for now I am going to assume that the green up trendline holds support.

I also sketched in a couple of red lines on the chart pointing out the possibility at least that a somewhat large head and shoulders topping pattern may develop if we continue to correct down to 870 on the Sp500. 

Read more