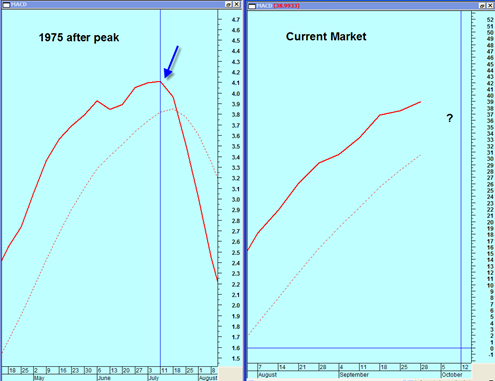
The chart above shows the weekly MACD plotted against the S&P500 for the 1975 period (left half) and the 2009 period (right half). The downside weekly MACD crossover that occurred in the 1975 period was the first major turn in that market after a super sized rally that was in progress from the major 1974 bear market lows.
The weekly MACD is nice to use for turning points sometimes because it evens out all the extra noise and helps to identify more meaningful turning points. Sometimes it fails during extremely persistent trends.
I have written a few times before here at BestOnlineTrades about the similarities between the current mega rally from the March lows and the mega rally that occurred from the 1974 bear market lows. The likeness is quite surprising and if the similarity continues then I expect we will get a bearish downside crossover on the weekly MACD similar to what occurred during the 1975 period that led to an eventual approximate 15% downside correction and then went into a 5 to 6 month basing period.
The current weekly MACD has not turned down yet and it has not achieved a crossover yet. But I think we are close. I calculate that the cross should occur within the next 1 to 3 weeks, most likely by mid October. For the weekly MACD to start turning down so that the MACD signal line gets close to crossing the moving average line (dotted line), we need to see in the week ahead and the week after price CLOSES that are not much higher than the recent all time highs. Preferably we want to see price closes that are in the current S&P500 trading range for a week or two. That would help this weekly MACD towards a bearish cross.
The mid October time frame is consistent with Terry Laundry’s latest T Theory Update. (He has an audio update and PDF chart that goes with it).

