The Gold Price is Behaving Badly Again and May Turn Very Bearish

gld20100324

The Gold Price is not inspiring that much confidence right now.  The US Dollar Index got a huge breakout going and gold seems to be shying away from the recent range.

I indicated in my previous post on gold that a move above 114 was critical for me to start jumping up and down and get on the gold train again.  Otherwise there would be risk of bouncing around in a tiring dangerous trading range.  That appears to be the case now and it is important for the GLD ETF to hold 105 level as it would help to create a clean looking head and shoulders bottom formation.

If it breaks the 105 then there is a risk that the GLD wants to continue to break down in a confirmed A-B-C down taking us to perhaps the 100 level.

Read more

Not Short Selling until 50 day moving average crosses 200 day moving average

SP50020100324

My mindset right now is to absolutely refuse even thinking about shorting this market with inverse ETFS or any other means, until and if the 50 day moving average of the SP500 crosses over bearishly the 200 day moving average.

Now you might say I am ‘slow’ or chicken to attempt to short this market until I get such a long term signal, but I would rather be a slow chicken that takes his time to get on the right side of a trend than super index trading expert hero that feels the need to try to pick the exact top.

For all I know this market may trade all the way back up to the old all time highs in a year or two.  In fact that situation has a decent chance of happening based on simple oscillating stock and index theory alone.

Read more

Las Vegas Sands Corp. (LVS) is behaving like a Champ

Marina_Bay_Sands_model_1 Las Vegas Sands Corp. (LVS) which I first mentioned as a possible breakout candidate here is behaving extremely well and right now is one of my favorite stock charts to focus on.

There are a number of reasons why LVS is worth keeping as a permanent watchlist stock for short term and long term tracking.

  1. Liquidity -  Las Vegas Sands Corp. is an extremely liquid stock and it moves nicely and seems to trend smoothly, not to mention the fact that it has a very clean chart from a short term, and long term perspective.
  2. Smooth Trending – I already said that, but I say it again because it is a great thing to have in any stock.  In fact if you did not tell me the stock symbol LVS before looking at the LVS chart, I would almost think it was a currency price chart as they also tend to move in more reliable trends.
  3. Options Liquidity – It has heavy options volume and plenty of liquidity in that department as well
  4. Its Cheap! – Relatively speaking LVS is still a lower priced stock and can still make some big moves. 
  5. It is a nice way to play the contraction and expansion of the economy as discretionary income levels contract or expand.  Got a little extra cash? Well then of course! Lets go blow it all off at the casino and see if we can win big!
  6. The Marina Bay Sands Casino in Singapore (pictured above) is scheduled to have its grand opening on April 27, 2010 after Las Vegas Sands Corp invested 3.895 billion dollars on it.
  7. It is a proven business and not a China Stock that is just starting operations an unproven.  Don’t get me wrong, I like all the little China Stocks, but many of them recently have plunged 30% in a few days time because of ‘accounting problems’ and other crazy reasons.  China Stocks can move big but a lot of them are still unproven business models and still highly speculative.
  8. They have a ‘sky garden’ on top of the Marina Bay Sands Corp Casino! Man would I like to hang out in that park on top of those three large buildings! Totally AWESOME 🙂 If there ever was a place to take a woman out on a ‘first date’ that would be it !

Read more

Another Long Term Chart of Natural Gas

sc 

This chart was sent to me by ‘Michael’ and is a nice piece of chart work on on the natural gas contract so I thought I would repost it here and let it basically speak for itself.

When I look at this chart it has me thinking that the bottom in Natural Gas may be sooner than I realize because when I look at the pattern of 2009 and 2010 and then compare it to the pattern of 2001 and 2002, one could make the argument that we have ALREADY made a W Bottom and now we are simple making a similar ‘handle’ as we saw in the 2002 time period.

Also significant is that we are right now near the 61.8 fibonnaci retracement level near the 4 range.  That 61.8 fibo level may provide some significant support to the natural gas contract as we close out the month of March.

Read more

The UNG Natural Gas ETF is Going into a Death Spiral

This may be one of the most important posts I ever write.  Well, actually scratch that… this may be one of the most important precursor posts I ever write to the eventual ‘signal’ post that I do on the UNG natural gas ETF.

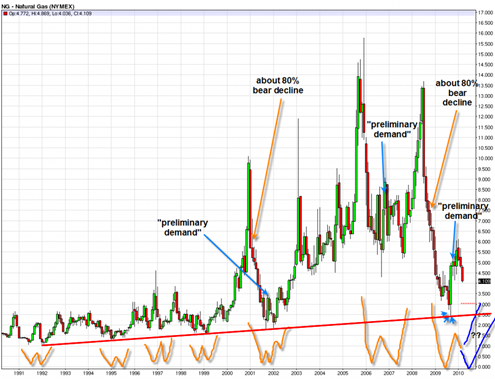
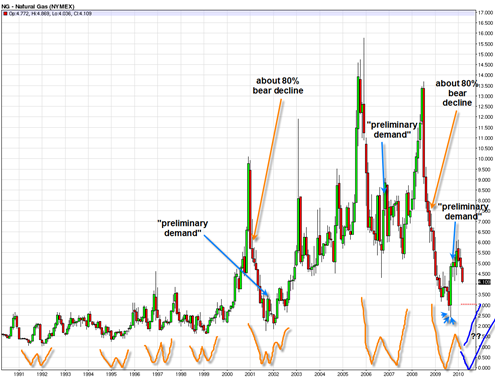
As of the date of this post, it is clear to me that the current most recent trend is down in natural gas futures.  The recent natural gas inventory report that came out last Thursday at 10 am helped to kick off another bearish leg down in this all to abundant element.  But my take is that there is a lot more to the story than that.  There is a larger chart structure that may provide some significant clues as to what natural gas will do in the future.  More on that in a moment…

But first I just think it is really fascinating how Natural Gas Futures have been behaving for the last year.  It seems to have a completely independent mind of its own and could not care less what oil, gold, or the stock market is doing.  This is an important fact and one of the reasons why I like to keep track of what it is doing.

Why? Because it can provide a potentially completely different and much better risk reward setup when most other securities and indexes are all doing pretty much the same thing.  That trading dynamic is my favorite one because it potentially allows you to participate in a brand new trend that is in a completely different trading cycle than everything else.  It allows you to completely separate from what 90% of what everyone else is doing.

Read more

AIB Allied Irish Banks and LYG Lloyds Banking Group PLC (ADR) Still Bullish

Both of these bank stock charts are still looking bullish to me for more potential upside in the week(s) ahead.  The attraction of AIB is that it is late in the recovery compared to many US banks, but still the price chart has some positive aspects to it in my opinion.

For starters, it has what looks like a double bottom that has about 1 full year distance between the potential bottoms.  The substantial distance between the potential bottoms is a good technical setup that could have a lot of potential significance from a longer term perspective.  The double bottom is not a confirmed double bottom.  I am just trying to make an ‘early call’ that it will be one as we go forward.

AIB appears to be testing a resistance range and has recently stalled there.  There is some slight resemblance to a cup and handle pattern developing that could send AIB to the 6 range assuming we get a northward breakout this week or next.

aib20100322

Similar to AIB, LYG Lloyds Banking Group, another ADR (England) appears also to have a quite bullish looking setup for a breakout north through resistance soon as well.

Read more

Las Vegas Sands Corp. (LVS) Weekly Price Chart Looking Very Good for a Breakout

lvs20100317

Las Vegas Sands (LVS) the casino and gambling co. has what I consider to be a very bullish looking weekly candlestick chart.  It is interesting that the basic structure here is somewhat similar to the way GE General Electric looks and GE recently managed to get a substantial sign of strength breakout on huge volume.

The challenge for LVS is to get a sign of strength weekly price breakout over and above the 20.73 level.  The price chart shown above has a lot of sideways cause and is a bullish sign for supporting an extended weekly breakout.

Assuming a breakout (perhaps next week sometime ?) a quick retest back to the 21 area would be expected and preferably on low volume.  The sideways pattern of the last 5 or 6 months resembles a saucer formation.

Read more