sp500 Confirmed Weekly Sell Signal Today

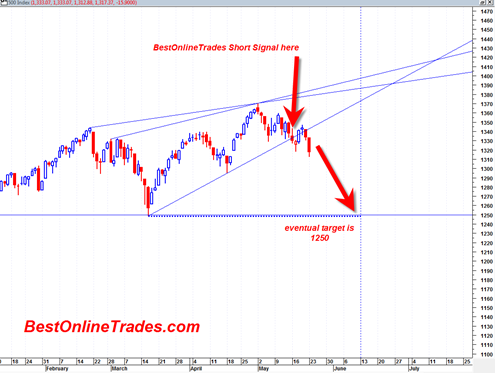
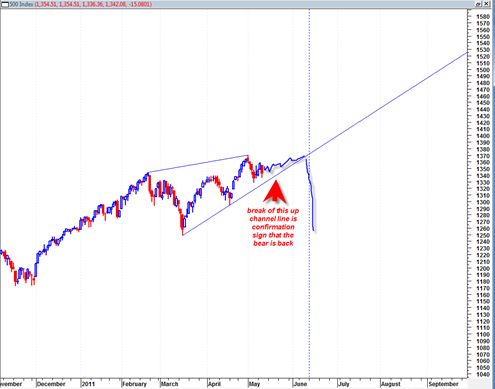
The sp500 is confirming a weekly MACD histogram sell signal today and today’s action puts the market in my opinion now in ‘bear mode’ for the near term and intermediate term future.

We correctly turned to a BOT Short Signal on the market on May 11, 2011 at 1338 and since then the market has complied with the signal.

I expect 1250 to be tested on the sp500 eventually.  How long that would take is a guess at this point but generally speaking downside price action tends to be faster than upside price action.

I am a bit confused at this point on whether the June 13, 2011 turning point has occurred a few weeks ago or whether the sp500 is moving into a panic low on June 13, 2011.  It is still too difficult to make a decision on that point.  It does seem as though the turn has already occurred and the current negative price action is a sign that the cycle turn is occurring NOW and that this could be an important phase shift for the market.  But I will keep an open mind and see how the waters look as the weeks progress.

Read more

SLV ETF Looks like a Great Buy in this Range

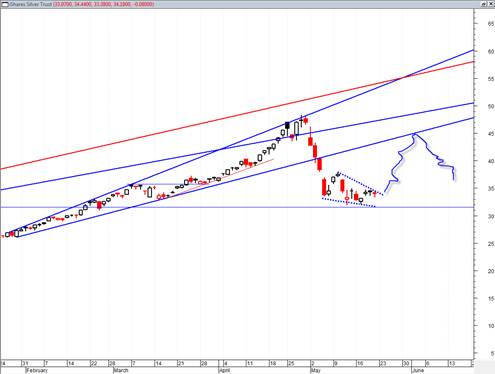
The SLV ETF looks to me like it is evolving into a great buy zone right now after the previous mini crash.  I indicated several times in the past that the 5/5/2011 climax low would be difficult to exceed given its blow out volume and also that the swing low of 33.58 would not be exceeded or only marginally exceeded.  Currently this appears to be exactly the case.

I think the SLV is a good buy in the current zone and I think it could move into a topside move that creates a trading range.

I would definitely be wrong if we break under 33 again significantly and close under there for several sessions.

It always amazes me how many are so quick to talk off the ‘silver crash’ and the end of silver and that the run is over after high volatility moves as we have seen.  The hysteria over new margin requirements and all the panic associated with that will eventually burn off.  This is not the end of the silver bull in my opinion.

Read more

This is a Boring Stock Market

The action in the stock market indices as of late has been out right boring in my opinion.  Where is the volatility? It is almost non existent.  This market is lately reminding me of the 1995 to 2000 time frame.  Slow trending markets, low volatility for the most part with occasional brief corrections, and sometimes more notable corrections.  It is utterly boring!  I want to see volatility like we had in 2008, at the low in 2009 and the mini flash crash of May 2010.  But I do not think my wish will be granted any time soon.  I think it is fair to say that for the most part markets spend most of their time oscillating slowly in trading ranges or slow trends.  Very high volatility is indeed a rare bird.

We are getting into the summer time frame where the market moves into a low volume typical trendless fashion anyway.  But we are only in late May now.

The market has declined since I issued a BOT short signal on May 11, 2011 at 1338 and we are currently trading slightly above that right now.  But this has hardly been a severe decline of any magnitude.  I will keep the BOT short signal active for a while longer depending on how the market behaves the next few weeks going into the June 13, 2011 Marty Armstrong Cycle Turning Point.

Read more

Minor Follow Through on the Downside today in the sp500

Today was a somewhat muted reaction to yesterday’s negative price action in the sp500.  The volume was light and I got no real sense that the market is ready to show a heavy bout of weakness.

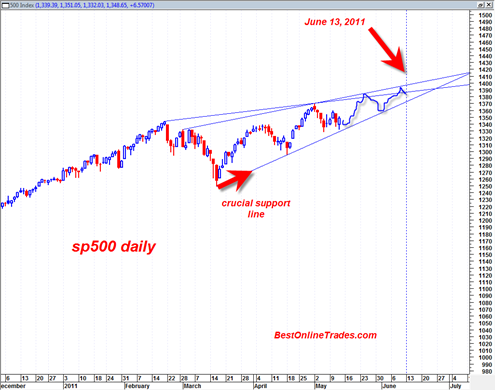
But I have been in this environment before and it is typically characteristic of the market to be very subtle and quiet before any major significant trend change is about to take place.  I could be wrong about us starting to form a top now and the market may revert back to my original theory of the sp500 moving to 1470 before any more sustained downside reaction is to occur.

The market should provide an more definitive answer about whether it is at a top level or wants to progress to 1470 within the next 20 to 25 trading days, or somewhat earlier.

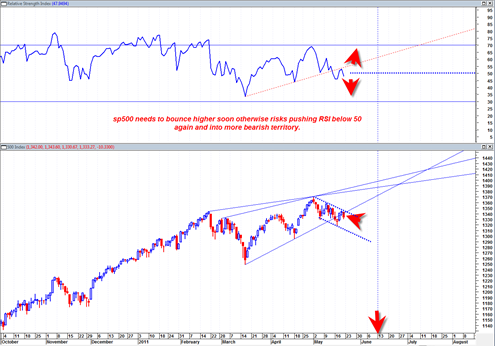
The answer should come in the form of either an upside breakout from the rising wedge formation we are currently in, or a downside break down.  The parameters seem to be quite clearly defined.

Read more

Sp500 could be Working itself Into a Major Top

The price action in the market since the 4/21/2011 swing low has been quite laborious.  Yes we have been in an uptrend, this is true, however the nature of the uptrend concerns me relative to the 2/18/2011 swing high.

This market is currently struggling to exceed the 2/18/2011 previous 52 week high, in fact it looks like it is embarking on a process to roll over (down).  The observation which earlier today led me to initiate the BOT Short Signal was simply a quick look at daily, weekly and monthly MACD along with monthly MACD histogram.  In addition I made an observation of the tape action itself from the mid March 2011 swing low and observed the angle of incline combined with the time it took to do the incline.  This is definitely more art than science, but I have look at so many thousands of market charts over the years that one begins to get a good sense when the market is rolling over just by the pattern it is forming and not even looking at any indicators.

The fact remains right now that the daily MACD and the weekly MACD are in sell mode.  The monthly MACD is in buy mode, BUT there does exist a large potential bearish divergence on the monthly MACD histogram that has the potential to crack this market down LONG TERM.

One could also make the argument that the monthly price chart of the last few months resembles a little bit the monthly price chart topping action of mid to late 2007.

Read more

Sp500 Dips Below Key Support

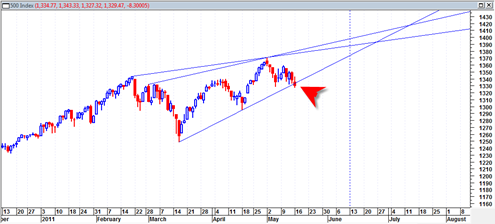
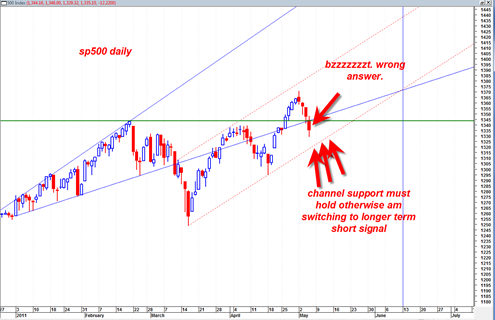
The sp500 today broke down through key support and volume was robust again.  A day like today is not supposed to happen if the market is still bullish.  Indeed today could be an important warning sign that this market wants to transfer into a more complex correction.  The up trend at this point may be on pause.

At this point I am still going to refer to the red dotted channel line as the key level that either holds or not for me to switch to outright bearish again.  This is a key channel.

Interestingly, the test of the bottom portion of the channel may coincide with some type of decision on the debt limit increase of the United States.

I do see that the daily MACD is in bearish mode and also the WEEKLY MACD is re confirming a bearish mode and trend.  The bearish weekly MACD is not something to be taken lightly now because if it continues it can eventually start to affect the monthly MACD and really start to roll this market over into a new down trend.

But it is still early and again, I want to see a break of the red dotted channel before I throw my hands up in the air and call this a new mini bear.

Read more

SLV Obeys Top Resistance Channel Line

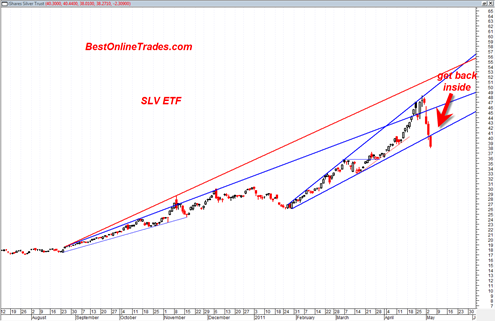
The SLV looks like it has obeyed the top channel broadening wedge resistance line and has since strongly reacted down off of it on very heavy volume.

This top channel line was known in existence for a long time and was pointed out here many times at BestOnlineTrades.com.  There was a chance that the SLV could trade to an extreme above 47 for a blow off move above the top channel line but now we see that this was not meant to be.

Now the SLV finds itself trading below the bottom broadening wedge boundary line and ideally will find a way to bounce back up into the broadening wedge.

There should be some type of ‘automatic rally’ from either the current price range or a little bit lower from here that could last for several days.  These almost always occur because of the previous strong momentum.  But it can be an art, not a science in pin pointing the exact low before it actually occurs.

Ideally a gap down opening tomorrow would serve as the panic low and mark the low and then the SLV could trade higher from there.

Read more