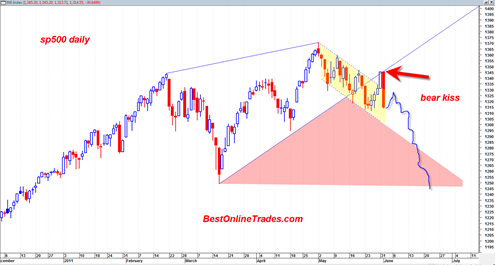
Today’s action in the sp500 has me thinking the 8.6 year cycle model turning point I have been talking about ad nauseam for months now is starting to take effect and turn this beast of a market into a sideways to down market.
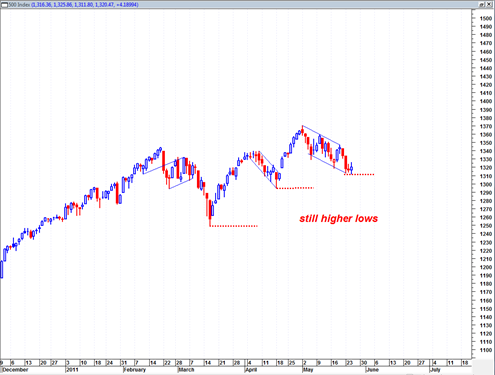
Today we saw the sp500 blast back under the tight channel I have been referring to and did so on robust volume on the SPY ETF. This was very bearish action today. The breakout from the channel yesterday was false. The market re asserted itself to a bearish trend today. This should keep the weekly bearish trend going again and continue to manifest the possible weak or weakening monthly trend.
I think it quite possible that we are at a very important top in the market here. It is no coincidence that this turn action is occurring only a week or two from the June 13, 2011 cycle model turning point.
In yesterday’s post I pointed out a very large possible structure on the Dow Jones Transportation Average that could take the shape of a massive head and shoulders bottoming formation. If true then we could see some hefty declines in this index to create the right shoulder of the pattern.
Even if we are at a major top here in the sp500 I expect it to be choppy. Tops take long to form and are messy at the top. Just look at the 2007 top and how long it took to fall apart.

