GLD Looks like a Buy above 151

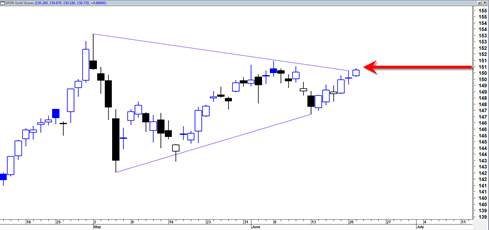
The GLD ETF looks like a buy above 151.  The gold price has been quietly consolidating in sideways fashion the last month or so and all things considered has not undergone significant price destruction. The GLD appears to be in a coiled state right now and ideally would start to lift off tomorrow out of … Read more

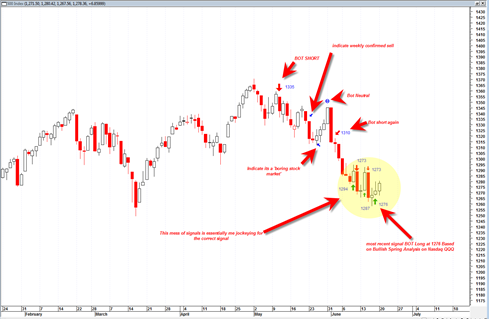
BestOnlineTrades Nails the Low in the Market Again BOT Signal Chronology

After today’s price action in the sp500, it appears once again that BestOnlineTrades dot com has nailed the low in the market with a good amount of precision.

We do not claim to be perfect here at BestOnlineTrades.com.  We do not pick perfect bottoms and perfect tops, but we know how to read the tape and follow the price action and the volume resulting in occasional powerful long or short signals in the sp500.  During the last few weeks I have barely followed the economic or fundamental news.  I do not watch CNBC or read Bloomberg any more.

I would say that my exposure to business fundamental news stories is almost non existent.  I follow the tape 99% and maybe occasionally get 1% exposure to macro fundamental news (sometimes it is just impossible to avoid, ie. driving in the car and hear news summaries between commercial breaks etc.).

In fact, I would say that my lack of exposure to fundamental news stories and lack of interest in them puts BestOnlineTrades at a very key competitive advantage relative to many other market timers and newsletter writers and other traders.  Why?  Because I am making my decisions based solely on the tape action and the volume.  Not just that, but also the interpretation of them minus any news bias.

Read more

Back to the Monthly Basics on the sp500

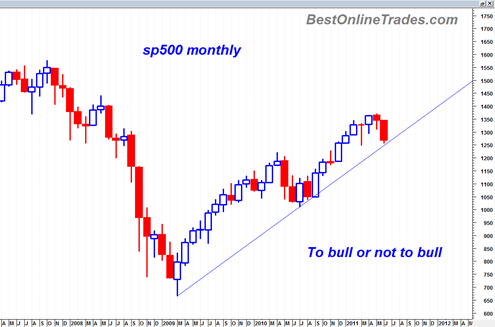
Back to the basics again.  The monthly basics.  I do short posts like this one just as a reality check.  It is very easy to get absorbed into the day by day action and the near term fear.

But the monthly chart of the sp500 right now since 3/2009 is still in an uptrend and still supported by an uptrend.  So, technically speaking I think we have to sit back and still say that as of today the sp500 is still in a mini bull market. 

Of course that could change next month or the month thereafter.  But as of this point in time the bull trend is holding.  It is simple point but an important one.  One that quite frankly I often forget to remind myself of.  It just goes to show how important it is to refresh the longer term time frames when it seems like the market is about to fall in a black hole.

Read more

QQQ is Showing a Bullish Spring Based on Volume and Price

I do not know why I did not notice this before.  Perhaps it is because I have not been following the markets as closely as usual.  I have been a bit pre occupied with other business lately and have not gone into as much depth on various market indices as I normally do. 

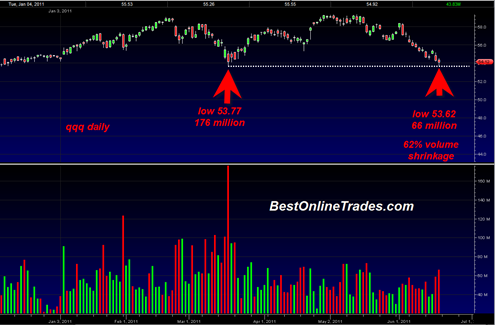
But I just pulled up a chart of the QQQ and it has me now thinking that this market has bottomed out based on volume.  Yes, just 2 postings ago I wrote a post on how the market now looks like a 50 50 proposition in either direction.  But after looking at the QQQ, it makes me think the market is already saying it has rejected the lows today based on volume and price.

Look at the chart below to see what I am talking about.  This is basically what market analysis boils down to, volume and price.

We today tested a very important previous March 13, 2011 high volume swing on 63% less volume and then closed back up inside the range.  That is a bullish spring based on volume and says the bottom is in.

Read more

5 Week RSI on Sp500 Seems to Be Saying we Bounce From Here

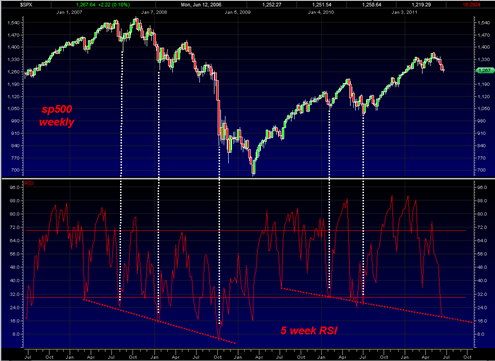
Someone emailed me a chart of the sp500 against the 5 week RSI indicating that it looked very oversold.  I decided to investigate and looked over the chart myself.  I find myself coming to the same conclusion.

I do not think I have ever focused on the 5 week RSI for timing but it seems to be making a case for a bounce from here on the weekly basis.

Of course 5 week RSI can always get more oversold into ‘extremely oversold’ range.  It is a matter of probabilities.  But the current 5 week RSI reading is showing that the market is the same oversold condition as was the case only 3 other times going back to early 2008.

If we are going to get more oversold on the 5 week RSI from here then it would start to challenge the oversold level that occurred during October of 2008 which was an extreme record and major outlier.

Read more