The bull case and bear case is never really totally clear unless you branch out to the much longer time frames.
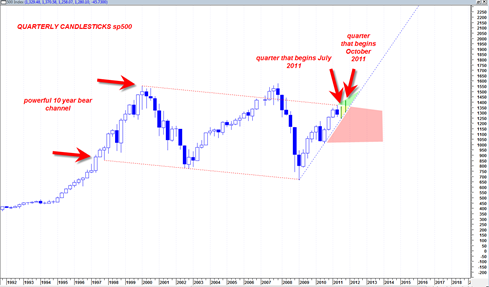
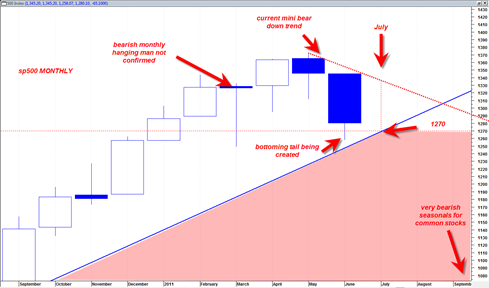
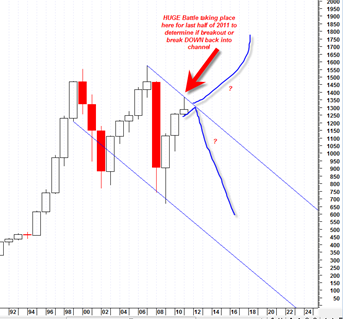
Based on the quarterly sp500 chart I can only make the conclusion that the market is still in a potential zone for more bearishness and also in a potential zone for more bullishness. You will understand what I mean when you look at the chart below.
The fact is that the sp500 has been trading in a 10+ year long trading channel sideways in nature with a slight downward slope. There are two more quarters for trading in 2011 and if you look at the chart below you will see that as long as the two trading quarters are still supported by the dotted blue up trend line, then the market is on track for a massive 10 year channel break out.

