Cancelling Yesterday’s BOT Short Signal

I am cancelling yesterday’s BOT Short Signal.  There is a chance the market may still form a cup and handle pattern that it could break out of and then eventually move higher.  There is also something that looks like a small head and shoulders on the SPY going all the way back to late May. … Read more

A Possible 100lb Gorilla Trade is Developing

There is a possible 100lb Gorilla type trade developing quite soon.  I have been researching it the past few days and am trying to assemble the information in a coherent manner so that it can be presented properly. This could turn out to be a huge position type trade.  The trade is highly liquid and … Read more

The Untold Sp500 Story

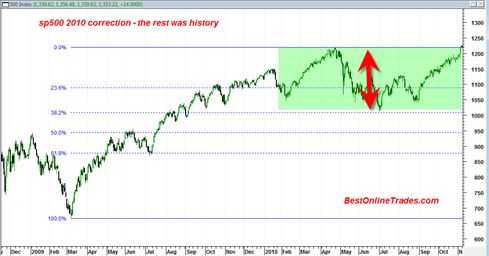
There is a somewhat untold sp500 story that I would like to talk about in this post.  It has to do with the recent correction we appear to have recently completed relative to the price advance that began on 9/3/2010.

We hit two significant price swing lows in recent months on the sp500.  One of them was the March 16, 2011 low of 1249.05 and then there was a follow on higher low of 1258.07 on June 16, 2011.  Both of these swing lows were within the 38.2% Fibonacci retracement zone (pretty close to it) relative to the advance from 9/3/2010.

So once again we see that the sp500 was not able to do more than a 38.2% retracement of the entire mega rally that began on 9/3/2010.  This is an important fact and points once again to the internal strength and momentum strength of the sp500.

Read more

Operation Scorched Earth

This last week of upside trading was a total blow out to the upside.  It was almost as if ‘they’ had a plan of operation… like a scorched earth type of plan, not giving the other side a chance to get out.

There is a candlestick pattern known as ‘three white soldiers’ which is essentially a bullish signal because you have 3 successive long white bullish candlesticks in a row and it tends to be a sign that a new crowd is taking hold of the tape.  But looking at the tape I see not 3 but 5 of them.  So I can only assume it is giving the same signal.

Now comes the question whether July 5th will be a down day or not since 5 up days in a row is rare enough as it is.

I would say that odds suggest that it will be a down day (or at least some type of consolidation hammer day) because today we hit and stopped right at the previous ‘shoulder’ of the 2/18/2011 high.  It looks like a natural resistance point.

Read more

sp500 Finished Quarterly Candlestick as Consolidation Hammer

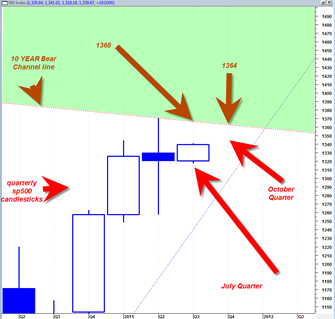
The sp500 managed in the final days of the quarter to change more negative looking quarterly candlestick into a more neutral looking candlestick.

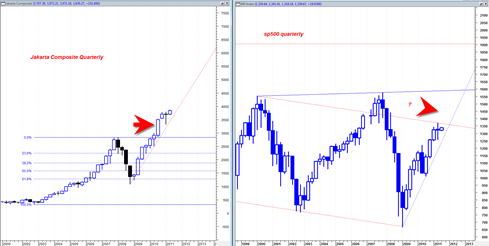
The quarterly candlestick now looks like a simply morphed doji or tendency towards a reversal hammer.  Whatever you want to call it, I have seen these types of candles form right under important resistance zones as consolidation candlesticks that lead to upside breakouts.

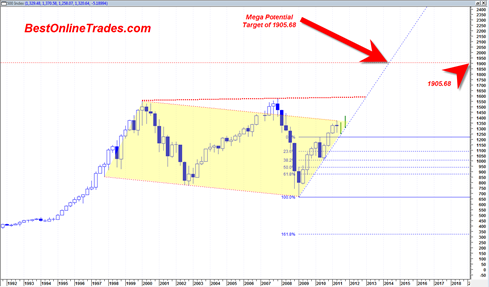
The resistance zone in the chart below is the 10 year sideways bear channel.  I break above this channel would be a bullish longer term sign and should lead to the sp500 moving to about 1600 and then with an outside chance of moving to a target of 1905.68.

The 1600 potential target is the top resistance band of a very large broadening wedge resistance line.

The 1905.68 longer term target, perhaps by end 2013 is calculated as an A B C upward projection based on the .382 % retracement that occurred in May 2010 time frame which was a bullish retracement in the sense that it was the bare minimum and showed a market with extra strength.

Read more