PIR Pier One Looks Ripe for a Breakout Soon

pir20090723

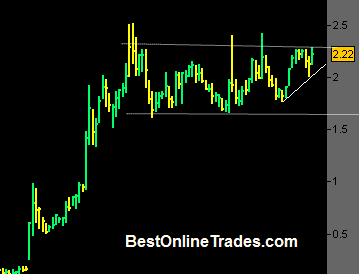
PIR or Pier One the specialty retailer looks like it is ripe for a breakout soon.

I am initiating a buy stop on PIR at 2.30 for tomorrow with a protective stop at 2.09

I like how PIR has held tight in this sideways range since early May and not given back too much ground especially considering how far and how fast it has come since the March lows.

It looks like constructive cause building to me.  There were two blow out spikes that occurred about a month ago, but in each case both of them failed to hold above resistance.  I believe those spikes are referred to as upthrusts. In each case they were on quite heavy volume.  So you saw new longs come in on those spikes and shorts unfortunately got blown out.  All of this is part of the cause building process. So now it seems patience is in order and lets see if PIR can get a breakout going here.

Read more

UNG Natural Gas ETF Reverses down hard

UNG2

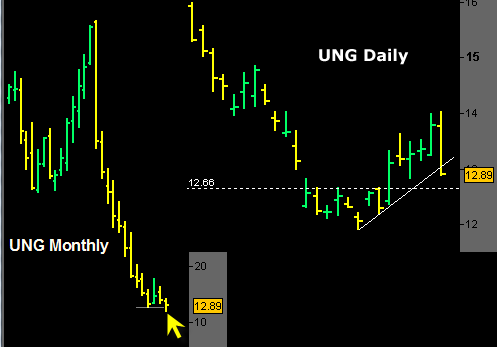
Ok well I am a bit disappointed in the way UNG played out. UNG stopped out today right at the close at 12.90 for a loss of 7.06%.  I suppose it is better to be stopped out right at the close of the day than to sit on something like UNG overnight.  This was a violent in your face reversal. Wow.  The chart above shows a clear birds eye view of what is going on with UNG.

The left side of the chart is monthly price bars.  You do not have to know much about technical analysis to know that this chart depicts a crashing price and severe price weakness. But the interesting part is the most recent monthly price bar that has a little yellow arrow pointing at it.

Read more

BEHL Biocentric Energy Holdings Penny Stock Worth Watching

behl20090723

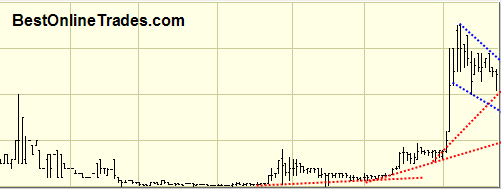
BEHL, a penny stock that trades on the pinksheets is worth watching to me because it has shown 3 signs of strength already since a few months ago and now is in a consolidation pattern that will either be a falling wedge or just a sideways channel.

I like that advance that BEHL has had since a few months ago.  The quality of the volume on the advances and the rapid decline in volume on the consolidations looks good to me.  A lot of times on penny stocks I tend to see heavy volume on the advances but then also excessive volume on the consolidations.  In my experience that has more often than not been a troubling sign.  But BEHL has not shown that and right now price is holding within the range of .02 to .035. 

So .035 is the top of the range.  I do not know how much longer this consolidation will last, but when either of those two blue dotted down trending lines on the chart above are violated, it will be the first sign that change is at hand.  I think there is an outside chance BEHL could do a swing low to .015 before the uptrend resumes, but I could be wrong.

Read more

FITB and CEMJQ

Both Fifth Third Bancorp FITB and Chemtura CEMJQ have initiated buy signals as of the early morning today and based on my previous post.  Both stocks were trading in congestion ranges similar to what was occurring in the SP500 and other broad market indices.

Today they have spoken and are now part of the BestOnlineTrades Recommended List.

FITB had a really clean and clear looking uptrend since the advance began in early March.  Up until now it has been stuck in a long somewhat sideways trading range and consolidation.  But what was clear was that it was not intending to give back that much ground.  So today we see a breakout from the resistance line.

CEMJQ has basically the same story as FITB.  I think FITB had a cleaner looking uptrend but the structure of both was more or less similar.

So for now I believe the trend is your friend with these too.

I think it is always interesting to do a side by side analysis of the broad market indices and then try to see part of the broad market action in the individual stocks.  I have always found that this helped me to gauge trends either up or down.  The broad market indices are indeed the ‘mother ships’ and the vast majority of stocks tend to follow them.  Of course there are plenty of exceptions at all times, but for the most part this is what I find to be true.

Read more

SP500 Index Trading Update

The short term sell signal I was talking about yesterday seems to be a wrong signal.  Perhaps I was splitting hairs too much.  It is still early, but the market is powering higher in what appears to be a sign of strength over previous resistance that exists in the late May to early June time period.

So I have to respect what the market is saying at least as of right now and am going to change the short term signal to long again.  This market wants to move higher and this move may be faster than many expect. 

I would like to add either the SPY or the SSO (SP500 double long ETF) to the BestOnlineTrades Recommended list but I would rather wait for the first pullback from this rally before initiating.  I hate to chase it after almost 9 days straight up.

It is still going to be interesting to see what kind of volume we get on this breakout today and if price can hold the breakout at the top of the range.  So far this looks like a sign of strength early today but we will have to see how things look by end of day.

Anyway, to summarize, the broad market has invalidated my short term sell signal I had yesterday.  This market wants to power higher.  The nature of this rally should be quite persistent given the modest retracement that occurred from the May to end of June correction.

Read more

IDOI IDO Security Pinksheet Stock at a Tipping Point

IDOI, the pinksheet sub penny stock that I have mentioned a couple other times could be at an interesting ‘tipping point’ going into today. I mentioned in an earlier post that I preferred it to make some kind of move this week otherwise I would not talk about it again.  Well we are almost as … Read more

There is a Blockbuster Trade Developing in the Gold Market

gold20090722

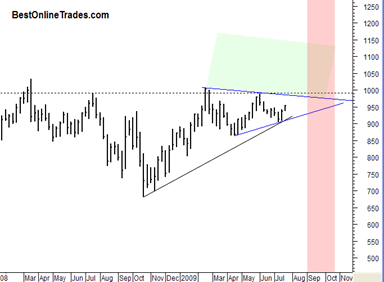
There is in my opinion a blockbuster trade developing in the gold market right now.  It is one of those slow motion type developments that usually catches people off guard.

This has the potential to be a very big trade in my opinion.

The chart to the left is a simple representation of what I am talking about. I will go into more detail on this in future posts.  You can click on the chart to the left to see it full size. The trade developing is a combination of a symmetrical triangle pattern in the gold price in addition to very bullish seasonals coming in September 2009.  The red shaded area represents the very bullish seasonal time frame for the gold price.  The green shaded area represents break out territory of the gold price from this several month congestion area also represented as a somewhat large symmetrical triangle pattern.

Read more