SP500 Index Starts a Retracement

sp50020090728 The SP500 looks like it wants to get a retracement going.  Currently I am thinking somewhere near the 950 level as I mentioned before being minor support and normal in the sense that often one will see price retrace right back to the breakout area.

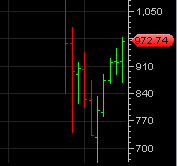
Also under consideration is the fact that we are only a few days away from the end of the month of July.  The little chart to the left shows monthly price bars on the SP500 index.  So the next opening price and initial price action for August will soon be printed on that chart.  It is possible, but unlikely in my opinion that the opening and continuation price for August will just easily continue at and above the 972 or higher level.  So instead I think we should see more of a retracement into the current July price bar for maybe the last few days of July and and then some days into August.  Then after that is complete a resumed move higher.

I am also noticing at least the possibility of a bit of a US dollar bounce upwards and that could stir some headwinds on the SP500 shorter term.

A modest price pullback during this time of year would not be extremely unusual.  We already know that the SP500 was able to make a valid break of the recent highs with adequate volume, so a retracement starting now is not the end of the world.

Looking at a price chart on the monthly scale has been very useful to me recently when you look at it in the context of what kind of range the next succeeding price bars will have.  It helps to quantify what the probabilities of the next price move is.

I should add also that if the SP500 were to continue upwards at the same rate as the last two weeks then we would quickly be close to SP500 level of 1100 within the next 2 weeks which seems highly unlikely, though not impossible.  So the upwards rate of change just got a bit ahead of us here.  So now I believe we will be in retracement mode. We shall see.

Read more

ETFC Etrade shows signs of New Uptrend

ETFC – Etrade Financial continues to show good signs of a new uptrend based on price structure and trading volume.  They recently reported another loss on July 22nd but CEO indicates that the recent money they raised will be enough to pull them out of their loan loss crisis.  In true market forward looking fashion, the market starts to mark ETFC up well in advance of any full resolution to their loan crisis.

etfc20090727b

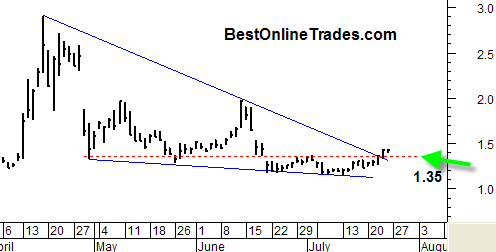
BestOnlineTrades added ETFC to the recommended list this morning very near the open at 1.47.  The stop is set at 1.38 but in this case that may need some fine tuning depending on if or how much of a pullback ETFC initiates this week or next.

The ideal buy price for ETFC was at 1.35.  But here at BestOnlineTrades we were a couple days late in spotting ETFC as a possible candidate.  If a 1.35 entry was taken than it would have allowed ideal stop placement just under that support area as depicted by the red dashed line.

Read more

ETFC Etrade Financial Possible Buy Setup

etfc20090727 BestOnlineTrades.com has spotted ETRADE corp ETFC as a possible upside trade this coming week, possible as soon as Monday morning (this morning).
Sometimes it amazes me how certain patterns and setups come to my attention.  It just so happens that I had ETFC stored on my computer’s archives of charts and had not looked at it in while.  But I can tell you that when I did look at it I was pleased what I saw.

I have found that finding new setups is not always a matter of just running a technical scan or looking at a top 10 list.  Yes, there are scores of filters and pattern analyzers out there, but nothing, I tell you nothing replaces the simple act of manually scanning through a bunch of charts with your EYES and using your mind as the filter.

That is what I did this weekend and so far I am pleased with what I see in ETFC.

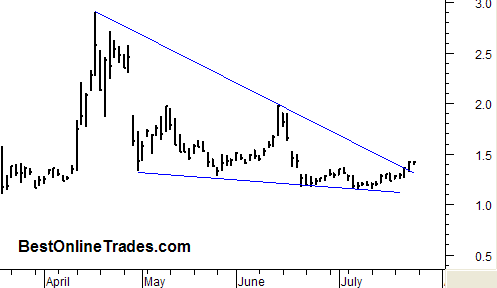
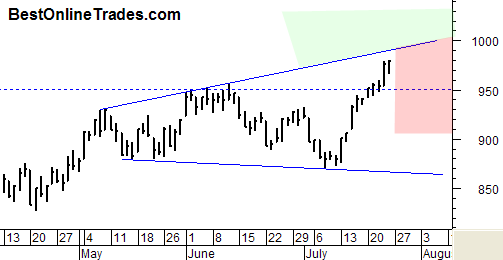
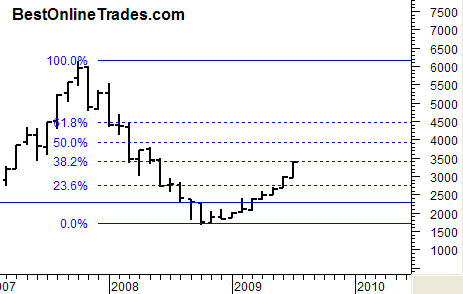
ETFC appears to have a somewhat large pattern formation that resembles a large falling wedge.  Within the past few days ETFC has elected to peek its head above water and slightly pierce the down trendline that makes up the top portion of the wedge.  The volume on the very recent move was very robust.  To me it suggests ETFC may want to get a run going soon, especially with the broad market wind at its back.

Looking at the chart, I see a possible upside here of the top portion of the wedge.

Read more

Professional Investment Strategies ETF Trends

globaltrends

Don’t ask me how I stumbled upon the ETF Trends website but I did.  But then I happened to stumble upon Tom Lydon’s Global Trends Investments and I have to say that after reading the main page it was refreshing to see his strategy clearly spelled out right from the get-go without any having to dig through tons of prospectus material or other fine print.

It seems like almost every professional fund management site I have been to is not too clear on exactly how they plan to manage your money or what their specific strategy is.  Perhaps they are but it takes a while to find out the real details.  That has been my experience anyway, maybe you have a different one.  But anyway I am going to call Tom Lydon ‘The ETF Guy’ because his site ETFTrends focuses on only one thing, ETFs.

Here is the quote from the main page of Global Trends:

At Global Trends Investments, we follow an investment discipline using the 200-day moving average and exchange traded funds.  When the markets are above the trend line, we are invested, and when they are below, we are in cash.  If there are no areas trending in the right direction, we exit equities completely and sit on the sidelines until the market trends turn.  We also have an 8% stop-loss, so when holdings are 8% off their high, the position is sold.  This exit strategy helps protect you from losing all of the gains made.

What a nice clear statement of strategy.  I like that.  I like it even more because there are technical criteria that make up the fund management strategy.

Read more

The Funny Thing about Penny Stocks is

By now you have probably noticed that I have featured a few penny stocks here at BestOnlineTrades.  The question that comes to mind is does a site lose a lot of credibility when they combine discussion of major market indices and more mainstream stocks with penny stocks? I think this may be the case.  But … Read more

SP500 has Valid Breakout but Approaching Top Line Resistance

spy20090724

The SP500 had a clear valid breakout yesterday on confirmed volume according to the numbers that I look at.  Yesterday was a ‘sign of strength’ and it was what we needed to see to make this a valid breakout above the 950 level.

I can tell you flat out that one of the most common pieces of price action I have seen over the years which happens almost with spot on regularity is the retracement of price right back to the breakout level.  In the case of the SP500 that would be near the 950 level.  So if we can get a retracement back to that area on low or weak volume it would be an ideal scenario of going long as long as that support holds.

Read more

Shanghai Composite Index is Booming

shanghaicomposite

I think the 500 billion plus economic stimulus package that the Chinese implemented is working, not just working but working really well.  Just take a look at the Shanghai composite Index.  The rebound recovery rally in the Shanghai composite started about 4 or 5 months earlier than the USA’s recovery rally as measured by the SP500.

So far the Shanghai Composite is up about 104% from the intra month lows in late 2008.  Wow.  That is pretty amazing how far this index has come and how fast.  It has me thinking that if this index continues powering higher up and through the 38.2 fibonacci retracement level there is probably going to be a mad panic rush to China stocks.  Of course there already has been plenty of activity in Chinese stocks, but it could go into overdrive with the cooperation of this index.

Read more

IDOI IDO Home Land Security Stock Still Constructive

idoi20090724

IDOI, the pinksheet penny stock that you have already heard me mention several other times still has a constructive look to it.

I mentioned earlier in the week that I wanted to see it move by either yesterday or today. Well so far that has not happened and I am willing to give IDOI a little bit more benefit of the doubt.  It is getting some late day hits at the ask here on this slow Friday.

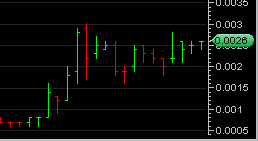
The reason why I am not giving up on IDOI yet is because instead of price continuing a slow and slopping downtrend that it was on track to do, it has instead popped its head up with decent volume and held up above the mid .002’s range quite well so far.

Of course all of this could change in a New York minute on Monday morning, but as of this writing I have to say the behavior of it is quite admirable.  I don’t know if I am going to keep a formal list of recommendations for these sub penny stocks and penny stocks that I cover.  Perhaps I will keep a more informal list just for record keeping.  So basically that means that I don’t think I will keep publishing an updated list.  However I will occasionally publish a list based on what I have talked about and what it ended up doing.

So informally lets put IDOI on the list with an entry of .0025.  I think that is reasonable since I have been talking about it for about a weeks time now.

I think what I will do is create a summary page of all recommended penny stocks and sub penny stocks.  It will not be updated in real time, although I will try to, but that way I don’t have to keep posting the list within the article postings.

Read more