Yesterday I downloaded from an online database the entire full list of all ETFS and then converted their symbols so that they could be displayed in my charting program. I am not too sure why I did not do this before because I can tell you with zero doubt that ETS are really a superb trading and investing vehicle.
You’ve got leverage, liquidity, choice, flexibility, low fees. I mean what more could you ask for ? Why even bother with stocks or futures or anything else for that matter when you have ETFS? It is something to think about for sure. Me personally I like to have as many options as possible, because you never really know where a good trading setup might come from. Yes there could be a great ETF trading setup, but there could also be a great setup in a penny stock, a blue chip, a Canadian stock, many places!
But I can tell you after scanning through 415 ETF charts one by one in my charting program something occurred to me. A lot of their patterns look the same and…
95% of them follow what the SP500 does!
It’s true. Most of them bottomed in March 2009 and most of them have been moving up since then. Some stronger than others, but their primary direction has been in line with the SP500. Perhaps this is an obvious point since many ETFS contain sector component stocks which also trade on the SP500. And some of them just follow specific sectors. Even commodity ETFS followed the SP500 as well.

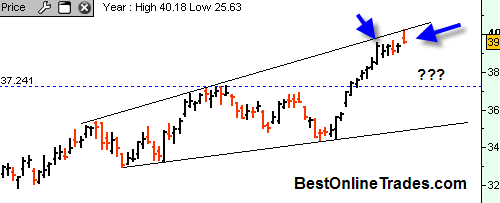
 Yesterday I was talking about how I noticed a confirmation sell signal on the QQQQ’s based on price and volume. But today we really don’t seem to have confirmation either way. Volume was slightly higher on the Q’s but as far as price goes we did not test either the high or low of yesterday so we really don’t have much new information to go on. Today is considered an ‘inside day’ since we stayed within the low and high of yesterday. Tomorrow, if we again stay within the low and high of today, then that will be a ‘double inside day’ and would be a sign that a big move is coming. Confused yet?