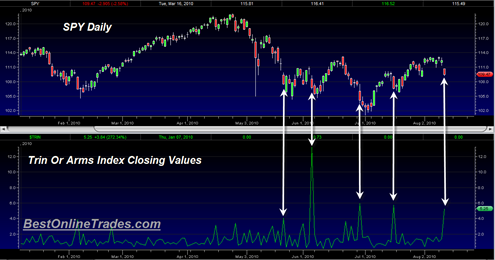
The TRIN or Short Term Trading Index also known as the Arms Index hit a spike high of 5.53 today. The TRIN or Arms Index is a good short term measure of oversold and overbought conditions in the stock market. Extreme closing values can be important clues about the possible next market direction. It will be interesting to see what today’s closing TRIN is.
In bull market trends you tend to see occasional spike high closing TRIN values that indicate a quick dumping of stocks in a shot gun type fashion that relieve the market from overbought conditions and then allow it to rally thereafter.
On June 4th, 2010 we saw a record extreme high closing value for the TRIN above 12. Since then we have seen two more very high TRIN closing values above 5. Whether or not we close above 5 again today remains to be seen.
The chart below shows the spike high TRIN closing readings and the relative state of the SPY at the time. It is an interesting way to look at the market levels of overbought/oversold.
I am not drawing any firm conclusions from this chart, but it is interesting to note how quickly the TRIN shot higher right from the top of this rising wedge. This could mean that today’s decline is one of those ‘shotgun’ type declines without more extended staying power.
It would have been much better if the TRIN had stayed in the same stance as it looked in the late April 2010 time frame. TRIN never really got into a deeply oversold stance until early June 2010.


Tom
I totally agree with your observation. For the bears, it is too bad that the trin shot up so high today. Unless we are headed over the cliff, this high trin is not favorable to bears
Tom
I track the 10 Day Moving Average of the NYSE Trin. After the June 4 reading of 13.22, the 10 MA peaked at 2.63 the next trading day. Over time the 10 MA hit a low of 0.94 on June 21
The next major single day Trin spike was on June 29 at 5.97. After that spike, the 10 MA spiked to 2.13 the very next day, and did not hit a low of 0.90 until July 15.
The next major single day Trin spike was on July 16 at 5.77 and the 10 MA did not “spike” to 1.56 until July 29. The 10 MA low was hit on August 4 at 1.05
With the Trin spike today of 6.25, the current 10 MA reading today (August 11) is 1.72.
After each day’s spike indicated, the TRIN the next day was considerably less, e.g. 2.01 on June 7, 1.58 on June 30, and .93 on July 16.
However, I conclude that there is still a “lot of room” for the 10 MA of TRIN to increase from the today’s level of 1.72. You could have a single day TRIN reading of 10.00 tomorrow and the result would be to bring the 10 MA to 2.63, similar to that of June 7.
Interesting Geoff,
I suppose I need to find a time where a big market decline actually started from a big TRIN reading. Maybe it does not exist. Would have to look quite far back in history.
Your right about using the moving average to better catch the trend of the TRIN, perhaps you are correct. The other indicators and the summation index are not quite fully rolled over yet. They really need to roll over and then get some downside momentum for this market to fall apart.
Tom
My comment was meant only to reference point in the event that IF these are extraordinary times than there is room for 10 MA Trin to increase even from here – – based only on last 90 days.
Even so, on your excellent chart, it is clear that even after a high TRIN day, the investor still has some immediate trading time either intra-day up to a couple days to capture some additional downside weakness – – below the level of the high Trin day.
There was a relatively high Trin reading at the end of April – – a Trin of about 4.0 on your graph, and that was a precursor of large and long swoon.
In the end, the Trin is just one indicator.
I also do a 10 Day MA of Daily Net Advances vs Declines. We are currently on a string of 22 straight trading days where the 10 MA is positive. This is a relatively long string. It might turn negative (if only for a day) very shortly, but it would require the number of negative issues to be greater than number of positive issues over the next 2 days – – – – my point being that a strong upward move from here is possible, but I am going to guess not probable.
For reference, long strings stretched to 33 trading days ending January 20 2010 and March 30, 2010.
Unfortunately and importantly, I have found that the string of positive days can be broken, and reset by only one 10 day MA negative day which is disheartening.
Since March 2009, we have consistently had long positive strings punctuated by relatively short strings of negative days. Duuhhh, indicative of a rising market.