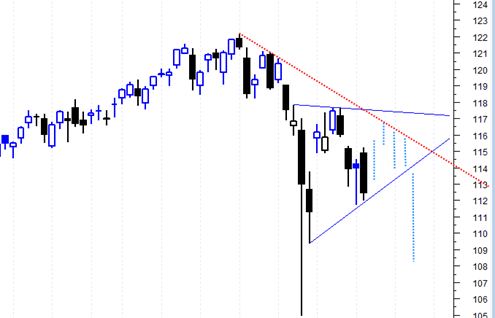
Here is another scenario for the SPY SPDR S&P 500 ETF which I probably should have thought of earlier. It basically allows for the market to trade sideways into the end of this week instead of starting a break down today.
It would make sense for the market to do that since this Friday is options expiration and there is a tendency for the market to move into a low volatility state so that option holders do not make a huge killing and instead struggle with low volatility. Apparently option expiration tends to have a slightly upward bias as well.
Also, after a second look at the symmetrical triangle I was talking about yesterday, I have this sense that it just seems too early to get a breakout going yet. Usually this type of pattern is filled in more completely.
So if true, this is what it may look like by end of week:
If it plays out like this then it would keep the May 23, 2010 scenario alive where the market runs into that date instead of selling off into it. That still is to me the most bearish possible scenario. In fact it would probably be ideal that Friday is up right into the weekend and Friday may be the ideal time to short the market.
I really am speculating quite a bit about this May 23, 2010 date or close to that date. It is an astro date that could have big significance in terms of turning points. Perhaps I am focusing too much on that date?
Well if everything works out perfectly, then we will see the market trade flat to higher into this Friday, then something big will happen this weekend, and it will slam the market down starting early next week and then just go relentlessly down all of next week.


Hi Tom,
The more I read your articles, more I have started appreciating your balance views.
There are many blogsopts/websites who only look at Elliott wave (or some similar tech patterns) and jump to conclusions. I am also fan of tech analysis but some times it makes sense to look around and see state of markets rather than just looking at tech patterns.
You score….
Please keep up the good work.
Thank you for your compliment. I understand what you mean. Maybe using a combination of different analysis is the best approach. Elliott wave is sometimes confusing to me because a lot of the time it seems like the wave counts change into something completely different. But still it is a useful tool to get some guidelines about the overall patterns. Combining volume with Elliott Wave would probably give it much better signals.