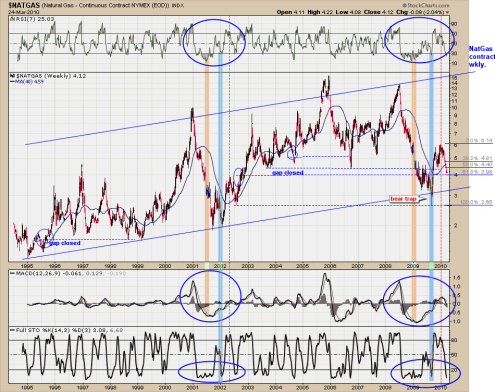
This chart was sent to me by ‘Michael’ and is a nice piece of chart work on on the natural gas contract so I thought I would repost it here and let it basically speak for itself.
When I look at this chart it has me thinking that the bottom in Natural Gas may be sooner than I realize because when I look at the pattern of 2009 and 2010 and then compare it to the pattern of 2001 and 2002, one could make the argument that we have ALREADY made a W Bottom and now we are simple making a similar ‘handle’ as we saw in the 2002 time period.
Also significant is that we are right now near the 61.8 fibonnaci retracement level near the 4 range. That 61.8 fibo level may provide some significant support to the natural gas contract as we close out the month of March.
So thanks to Michaels chart we may have an alternative scenario here where Natural Gas bottoms within the next month or two instead of several months down the road as I was thinking before.
But still, it is too early for me to tell at this point.
What I will be watching for is how we close the March monthly candlestick (in the next 6 or so trading days), and then see how the April monthly candle stick opens and starts to behave. If a reversal is going to happen near the 4 level, then we should begin to some signs of this as the month changes into April.
On the other hand if we are not ready for a bottom at the 4 level, then we should see continued ease of movement on the downside based on the weekly and monthly charts.
Another possible clue that may occur soon is a total blowout one day volume day in the UNG ETF. If we see a vertical drop and then maybe a 100 million or more shares traded in a single day, that could possibly be a final capitulation type day that marks the bottom.
So maybe I need to keep a closer eye on Natural Gas than I originally thought in terms of time frame.
 P.S. I just glanced at the updated weekly natural gas futures chart and I have to admit that the 4.10 level is sitting on a decent area of support. However from a tape reading point of view, as of now I see a very poor reaction from this level and no signs of demand. It is fussing around this 4.10 level too long where it should be jumping off of it like stepping on hot coals. But so far nothing.
If it breaks below 4, then it has a good chance of making the trip to 3.00 . That is still my take right now. But it is possible that we get a sharp upside bounce from these levels. So how we close out the month of March and start April is going to be very important.

