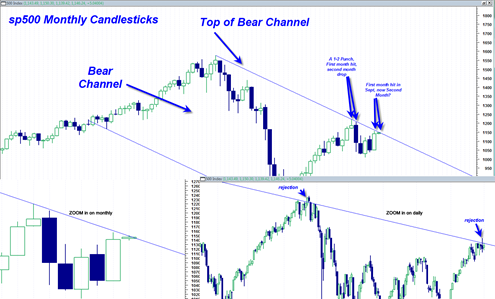
This long term monthly candlestick chart of the Sp500 is quite important. It shows that we are a very important battle line now in this long running debate between new bull market or bear market continuation point.
That is exactly where we stand right now according to the chart below. We stand at a point so precise that we are either on the cusp of a new bullish breakout trend, OR a continuation bear market point.
This chart makes it crystal clear. The main chart is the monthly candlestick price chart of the sp500 and the bottom left part of the chart is the ZOOM in of the current monthly bars. The bottom right of the chart is the ZOOM in of the daily time frame with the same long term down trendline cascading through prices.
What the main monthly (top portion) of this chart shows is that price has so far run all the way from March of 2009 back up to the top of the channel by the end of April. So we hit the top of the channel by end of April and then very strongly rejected the top boundary of the channel and slammed down in May Flash crash.
Now we find our selves once again hitting the underside of the channel by the end of September (similar in the sense that we hit the underside of the channel the first time around at the end of April). And by Wednesday of next week will be October 6th. So there seems to be some similarity in terms of the time frames (end of month) that we hit the underside of the channel and then very early in the first part of the next month we get slammed down hard.
You can see that the monthly candlestick for October is already forming right on the underside of the channel. Obviously it is only 1 day of trading in October so far but you can see the monthly candle trying to decide if it wants now to either strongly REJECT again the underside of this channel or do the complete opposite.
If you look at the daily portion of the chart above you can see that the doji reversal we had on Thursday was already a rejection on a daily basis above the channel. A similar occurrence happened on April 26, 2010.
The trend lines that define the top channel are drawn as precise as possible. My charting program snaps the trendline to the exact high or low price tick. Of course there is always some wiggle room, but I have to trust the preciseness of the line.
I must admit it is quite fascinating at how precisely price is reacting to this line even after all this time and confusion in the markets.
So the bottom line is that this current October monthly candle is now either going to bust above this channel or get slammed down in a strong bearish rejection.
This chart helps to give me confidence in the short side of the market because it looks very unlikely for me to see a northward breakout right from the first week of October. At a bare minimum I would think we should see at least a small bottoming tail created on the monthly October candlestick.
However at the same time, we need to keep in mind that a very strong gap up early next week right from the get go, or by Friday’s unemployment report, has the potential to create an unprecedented upwards surge in the market based on this long term channel set up. This scenario would only really become truly alive if we see price move above and hold above the long term down trendline with conviction. If we do not start to do that for a good portion of next week then I have to still believe in the short side.
I am no elliottwave expert, but the structure here also looks as though wave C down is about to commence and elliott wave 3 of 3 down into October. So the elliottwave count seems to confirm the bearish continuation scenario.
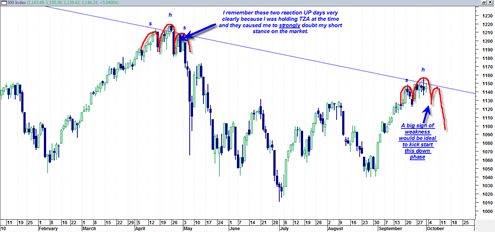
The ‘easy’ scenario for shorts next week would be a slam down hard early next week, followed by a short and weak rally once again back up to this long term down trendline, and then a total an all out rejection and collapse after that, see chart below for this speculation:
I can’t rule out the possibility that short positions will have to take some ‘heat’ next week, but I am hoping that the market obliges to this small head and shoulders pattern and makes it a bit ‘easier’. . .


Give me a break — that’s all I’m reading on the blogs – ‘we’re making a H&S top !!! ‘ — SO OBVIOUS — and great fuel for the next up leg.
And what about all these people that say ‘I am no Elliott Wave expert but …’ EWave is EXTREMELY tricky — don’t screw around with it unless you REALLY understand it.
Tom
You have put in quite a bit of work with 3 postings. Thank you! I would say that the preponderance of evidence favors the bears (see also my extended comment – – several postings ago)
The euro at roughly 1.375 seems very expensive and I would not be surprised to see a dollar rally soon – – if only back to 1.33 – – but fair value seems much lower, perhaps to parity – – altho from what I read the northern European countries are probably in much better shape than the USA. That being said the DAX index which you posted about rather recently has not been acting really that strong and the slow stoc seems to be rolling over from a very high reading, identical to DOW.
It may be time to lower my exposure to gold mutual fund a bit more. It is a bit of concern that despite the continuing new highs, they seem sort of grudging – – – but I am already at a gold core position level and really am not keen to take the core position lower.
In my experience practically 100% of the time that you think an upcoming trading session or trading week will be decisive, it almost never is – – but here is hoping for next week
Thanks your hard work and postings. You make interesting points.
Again, I say this market is very difficult to read! Granted there are lots of technical indicators indicating a big downside move but still there are lots of indicators which indicate a big move on the upside. No one has commented on the strong one day reversal Thursday. But no follow through. The McClellan Oscilator turned down for one day and then up again!
Eliot Wave is really difficult here ordinarily a Fibonacci retrace from ’07 absolute high to absolute low has a better than 78% Fib retrace. Ordinarily that points to a 100% retrace and indicates we still have quite a way to go on the upside.!
Perhaps we are seeking absolutes here and the market is simply not prepared to reveal its inner truth.
What to do, ride the waves. Trade! Maybe we are living in the best of all trading times. Riding the buycycle. Buying bottoms and selling tops. For me that is definitely the best of all possible worlds.
But that may be to Panglossian!
errata: should be too Panglossian. And I meant to say that we have already exceeded the 78% Fib retrace which points to a 100% retrace!
Another technical that is troublesome for the bears is the fact that the $INDU has just created a golden cross!
We have to be careful that we don’t allow our emotions to affect the way we read our indicators.
It is a pickum, that is why I find the best way to play the market is to watch the tape and to never fight the tape!
And where possible go home flat!
Sage advice from the old trader.
The curious point about the golden cross is that the market sometimes has a habit of doing the exact opposite of what one would normal expect when we either get a golden cross or bearish cross. For example on the last 50 DMA and 200DMA bearish cross in the DJIA on July 6, 2010, the market shot up from 9700 to 10400. That doesn’t mean we have to go down 700 points now on the DJIA, but it is weird how sometimes the exact opposite seems to happen in these golden and bearish crosses.
Well Jesse Livermore said there was not a bullish side and bearish side but only the right side to the market. That is easily said, but figuring it out can be tricky sometimes 🙂
You do make a good point. I probably have no business talking about elliottwave since I don’t understand it completely enough and quite honestly don’t like it much either. However from my understanding of the current count, the EW folks say we are at the most crucial juncture in terms of the count so I could not resist giving it a mention. As far as the H&S top, I am only speculating on the very small H&S of the last couple of weeks trading. The much larger H&S from 2009 seems to be of the quite complex variety and may be somewhat questionable but some are still strong believers in it. As to your point about great fuel for next up leg I am not sure what you mean. I think you mean in contrary sense since many blogs are bearish.