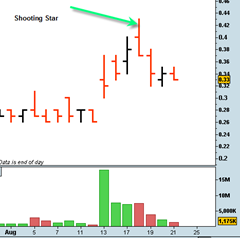
After a stock has had a significant advance it usually never pays in my experience to hold on after you see a price bar reversal that resembles a shooting star candle stick.
There are specific definitions of exactly how a shooting star candle stick should look. But in my experience, any price bar that shows a large intra day advance above the days previous high and then closes back under that high and near the bottom of the range is a very bearish short term signal for me.
It seems like almost every time I have seen one of these price bars the next day or few days price action has been very weak and down.
Sometimes these reversal bars can lead to really significant price destruction for a long time. It all depends in what phase of the trading cycle a stock is in. But regardless of the phase it is in, most of the time it is prudent to bail out and seek safer waters.
I remember ignoring this principle way back close to the year 2000 when I was in a stock called NetCreations. It was an email marketing company of the dot com era and the stock was in a trading range but then briefly broke out of the range with a very wide price swing but then did an immediate turn around and closed all the way down to the days low.
I was like a deer caught in headlights. I was so stunned by this move that it caught me off guard and I just sat on my hands. The result was heavy losses and a price decline that turned into a relentless price decline.
The key with these reversal price bars is that they usually have more significance after some kind of substantial price advance. If it is the first day of a breakout move from large pattern, the odds are that there is still some continuation left.
Be especially watchful of these after you have been riding a trend for some time.

