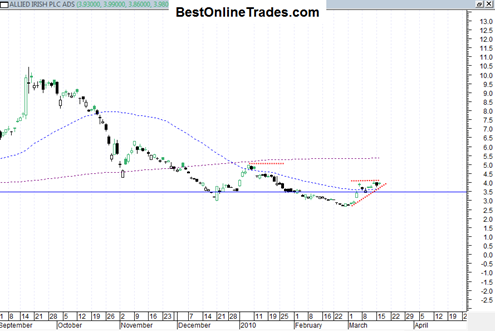
AIB Allied Irish Banks looks to me like a good trade from here. It is an ADR (American Depository Receipt) and has plenty of gaps all over the place. But if that does not bother you it may be worth a look here.
The solid blue line represents a long term support line going all the way back to 1991. In 2009 that support line was briefly violated and then a rally commenced all the way up to 10 and change.
Since then, price has drifted back down in a series of lower lows but recently AIB has managed to pop up and through the low of December 2009 on very strong volume and has formed a small but likely unreliable looking ascending triangle. I don’t know yet if price of AIB is going to race up and through this ascending triangle right away or not, but in general it is looking to me that AIB wants to swing right back up to the other side of this large trading range and the top of the trading range is marked by the 10 level and the low by the 3 to 4 level.
It really is quite interesting how AIB managed to hold support of the support line going all the way back to 1991. There is a little bit of give and take at that line but for the most part I think it is safe to say that support has held.
It reminds me of a similar setup that IBM had going way back to the 82 bear market lows and then a revisiting of that level in the 1993 time frame. But I think there is no argument that the AIB retest of support is a much more violent swift type retest of a whole different magnitude. Still, a support line is a support line no matter how far price was previously moving into it.
The fact that the world markets in general are continuing their melt up recovery should help AIB along the way. The XLF financials ETF looks constructive for a northward breakout out of the extended sideways trading range it has been in.
So to sum up AIB looks like a decent long play for an eventual move back up close to the 10 range. The first major hurdle however is the 5 and change swing point. A test and eventual break above that level would help to put a more confirmed end to the recent down trend.
P.S. I almost forgot to mention that the weekly MACD also appears to be in a bullish configuration now as well which should support this possible new uptrend.

