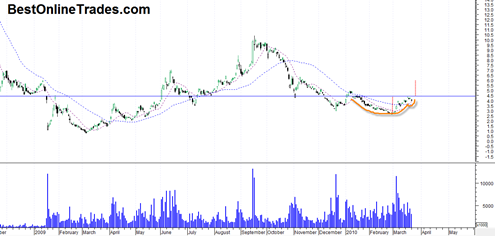
Both of these bank stock charts are still looking bullish to me for more potential upside in the week(s) ahead. The attraction of AIB is that it is late in the recovery compared to many US banks, but still the price chart has some positive aspects to it in my opinion.
For starters, it has what looks like a double bottom that has about 1 full year distance between the potential bottoms. The substantial distance between the potential bottoms is a good technical setup that could have a lot of potential significance from a longer term perspective. The double bottom is not a confirmed double bottom. I am just trying to make an ‘early call’ that it will be one as we go forward.
AIB appears to be testing a resistance range and has recently stalled there. There is some slight resemblance to a cup and handle pattern developing that could send AIB to the 6 range assuming we get a northward breakout this week or next.
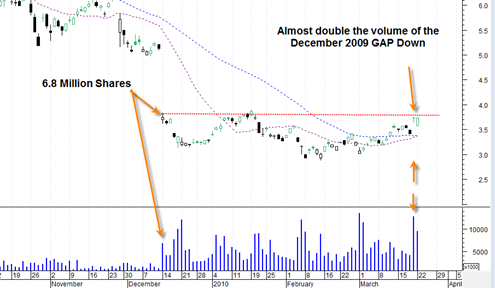
Similar to AIB, LYG Lloyds Banking Group, another ADR (England) appears also to have a quite bullish looking setup for a breakout north through resistance soon as well.
LYG has an interesting chart setup because there is a very large gap that was created in very late 2009. It could be a leading signal as to what AIB will do.
LYG in the last two days had a 12 million share day and a slightly under 10 million share day. These two volumes are pushing right under resistance and compare very favorably to the 6.8 million share day that created the gap in December of 2009. Basically it is almost double the volume of that gap down volume day.
It remains to be seen how soon LYG can get above this very key red resistance line, but if the last two days volume is any indication it could happen quite soon.


