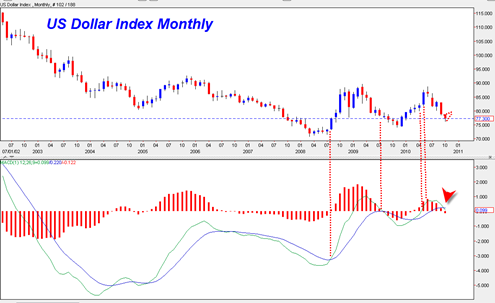
I am starting to think somewhat differently on the US Dollar Index. I was talking about the potential for a nice upside surge in the US Dollar in some previous posts because the Dollar found itself at the base portion of a large symmetrical triangle.
So far the Dollar has found some support and has had a few recent surges. But today it got slammed down again and is showing some confusion. Sometimes it takes a week or two or three for a security to gain its footing before it can reverse course.
But one must also contemplate whether the reaction is strong enough from support as an indication that support is valid.
The recent action of the last two weeks in the US Dollar on the daily chart may start to bear resemblance to a rising wedge instead of a reversal formation.
It seems clear that what the Fed decides to do or not do next week is going to have a big impact on the dollar. I think one has to be open minded enough to see a possible US Dollar break down of support.
On the chart above we see that the previous MEGA spikes higher in the dollar that hurt the stock market very badly only did so when the MONTHLY MACD stance was in a bullish crossover configuration. Both the 2008 mega drop in the stock market and the April and May 2010 severe correction action only occurred when the Monthly MACD was in a bullish stance on the US Dollar index. The middle dotted vertical red line in the chart above shows the previous monthly bearish crossing action and showed the dollar continuing lower thereafter. Something similar may happen in the current time frame.
But what do we see now ? Now we see that the monthly MACD is in a bearish crossover continuation stance and it could be argued that this does not bode well for the US dollar holding bottom triangle support.
It could lead one to believe that next week the dollar could see a break down, instead of a break up.
This could potentially mean another huge ramp up in the gold price and a break up in the stock market to new 52 week highs.
The current bearish sentiment in the dollar (I think 97%?) would seem to contradict the potential for a break down from here. But the monthly bearish MACD stance does not seem too supportive of a huge surge higher from here.
Contrast the bearish monthly MACD in the dollar with the current bullish monthly MACD in the stock market (and a potential bullish monthly confirmed histogram buy signal) and one can see the reverse polarities of the two taking shape.


If you look at the major indexes, you will see a steady climb up over the last two months. September and October. This kind of movement is not sustainable.
It amounts to an almost 10%+ move. It is time for the profit takers to come in and they will.
This market is overdue for a correction and it will happen!
I am taking little tiny steps into the short side. Holding back until I see the white of their lies.
I didn’t like the market action today. To me it looked toppy.
As I mentioned, this market has a lot to disappoint. Such as the election or even a move up on the dollar which appears to be oversold with lots of players very down on the dollar.
It even seems that the market has come to expect earnings above estimates.
My intuition tells me a correction is just waiting for an excuse.
Elliot Wave confirms Bradley Astro Turn dates 10/25, 11/15 and 12/25.
http://forbestadvice. com/Money/Gurus/DonaldBradley/BradleyTurnDates2010.html
http://www.marketoracle.co.uk/images/2010/Oct/Dow-elliott-wave- projection.gi
JR, i hope you are right
Took a large short position(20.3055) in Radio Shack(RSH) based on a what I think is a very bearish engulphing candlestick pattern.
Placed tight protective cover at 20.15.
Looking for a move down to mid 15s to to 16s.
We will see.
I am positioning myself for the anticipated correction.
I put the RSH 20.15 cover into effect when it moved below 20!
Got stopped out, but went back in at the close 20.12.
Look at the graph of this stock. The previous four days created a very bearish engulphing candlestick pattern. But then as the close approached today I realized the action for the day traced a perfect hanging man candlestick.
I would like to hear other comments about this pattern in this stock.
JR, sorry for the late take on RSH.
Just looked at the chart. I see that on Friday it got a reversal going on much lighter volume and retested the neckline of a small inverse H&S pattern during the mid August 2010 to early September 2010 time frame. I think it could bounce up to 21 or 21.5 before any possible move lower. A bit over extended to the downside now. This one can swing quite wide in both directions even if in a down trend. Good luck to you.