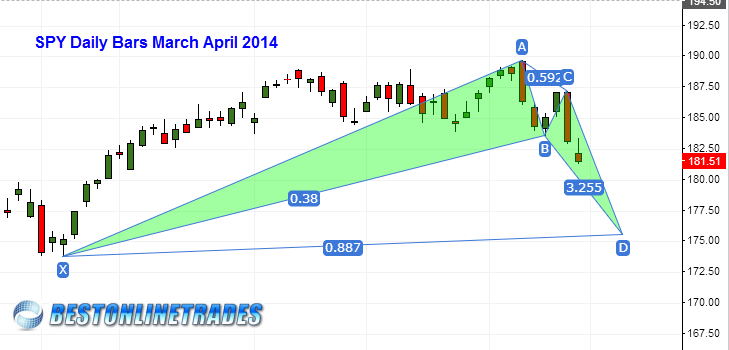
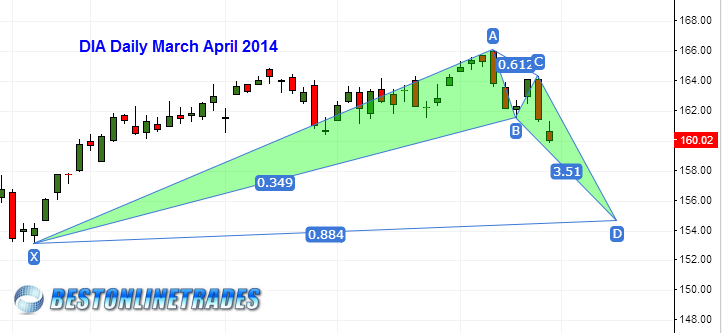
The SPY ETF and DIA ETF have bullish bat Fibonacci patterns that suggest any accelerated decline during the next 5 trading days (USA markets are closed on Friday April 18th) will likely be contained or stopped near the .886 Fib retracement level. It is possible that the target levels could be reached this Tuesday April 15th, or on the following Monday April 21st 2014.
In the SPY chart below the .886 retrace equates to the 175.53. In the DIA chart below that we see the .886 equates to 154.60


It is important to recognize that sometimes some of the Fibonacci reversal levels are never reached. It all depends on what the overall state of the market is and what kind of trend preceded the fib pattern. Using a combination of different time frames, additional indicators, and price tape action interpretation helps to provide clues on what any particular bullish or bearish Fibonacci pattern is telling us.
In the two price charts above there exists the potential C to D leg which is the last potential price leg of the pattern. It is not uncommon to see price gravitate very quickly towards the .886 Fibonacci level in this type of pattern. In fact I have seen many spike moves down in stocks occur on an intra day basis that tests the .886 but then closes the day at a much higher price.
There are two targeted astro/cycle dates during the next 5 trading days that could serve as magnets helping to pull the market down. April 21st is a major one and then April 15th is a second. A comment poster to a previous post clued me in to the April 15th date as having significant Astro/cycle significance.
So basically we are working with a possible window of 5 trading days to see if we can get to the .886 Fibonacci retracement levels. Assuming we do get down there in accelerated fashion some may refer to it as being a crash, but it is nothing more than a gravitation towards the key .886 Fib retracement level which is likely to act as important support. The determination of whether or not the .886 (assuming we reach down that far) will stop price will be better determined by focusing on signs/signals of candlestick reversal behavior and price support behavior.
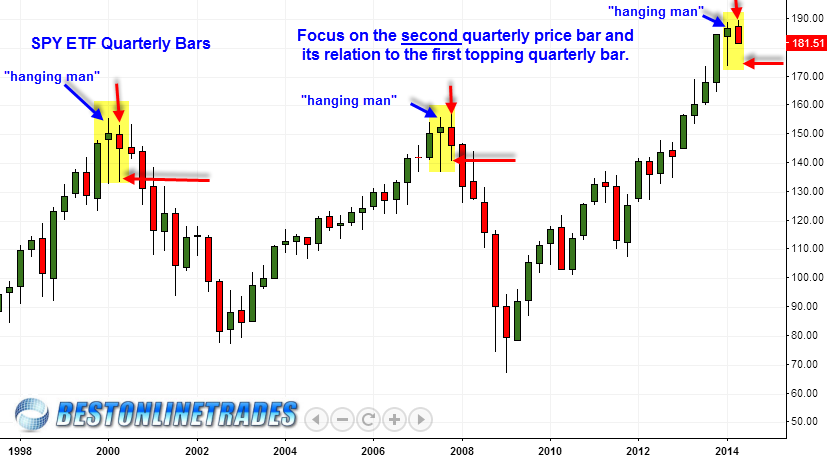
Sometimes I like to use the super long term charts to get a better idea of probable price ranges. For example take a look at the quarterly price chart of the SPY below (3 months per price bar). It is clear from this quarterly price chart that during the year 2000 top, and 2007 top there were two quarterly price bars (highlighted in yellow) that made up the final topping process. The first quarterly bar was a hanging man candlestick, and the second was a consolidation bar that marked the final topping process.

I have to say it is quite interesting that we see a quarterly hanging man candlestick showing up in each of the 3 years 2000, 2007 and 2014. The 2014 hanging man still needs bearish confirmation.
The current quarterly candlestick (April May June)is obviously still being formed in the SPY but it is important to gauge how it will react relative to the previous quarterly low. In the year 2000 and 2007 top the previous quarterly candlestick low was a zone of strong price reaction and support.
The Fibonacci support level 175.53 in the SPY ETF and 154.60 in the DIA ETF both make sense as support zones in the coming weeks. It could be that the much more serious decline will have to wait until the July August September quarter. Remember that major tops are a process and it would be quite unusual for a top to be formed with only 1 or 2 quarterly price bars. Even during the highly speculative March 2000 top it took at least 3 quarterly bars before the real devastating decline ensued.
The second quarterly bar in the year 2000 got to the .886 retrace level and slightly exceeded it before rallying up. In 2007 the second quarterly bar moved slightly lower than the .786 retracement. So here we are in 2014 and the second quarterly bar. What retracement level will be achieved on the second quarterly bar before some type of rally ? We might know the answer within the next 5 trading days.
