The tape action on the sp500 is not looking so great lately. We are coming into the end of the month of November and so the price action over the course of the next 8 trading days will be very important determinant of the longer term trend of the sp500.
The reason why is because I stated in a previous post that the monthly trend (based on the MACD histogram) was showing at least the possibility of turning into a bullish stance whereby it would initiate a ‘bullish triple P’ pattern and open the door for monthly bullish confirmation in December.
But as it stands right now 3/4 of the way through November, the sp500 has started to turn its November 2011 monthly price candlestick into a rejection candlestick (rejections of channel highs). This monthly price action so far has not allowed the monthly MACD histogram to keep the possible bullish reversal stance. On the contrary it has started to indicate the monthly bearish trend may want to re assert itself.
So if we maintain this current weakness going into end of November it could mean a nasty down December or at least a sideways to down December that leads into a quick down early 2012.
A lot can happen during the last few days of November 2011. Seasonally and just the simple fact that it is Thanksgiving USA week, it would seem very foolish to even consider any bearish tendencies.
But I am going to try the BOT short signal on sp500 at 1215 at this juncture.
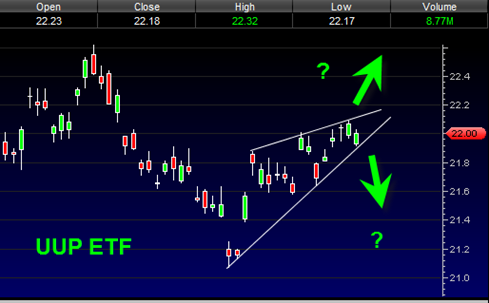
We should know in short order whether I am right or wrong with this signal. The UUP (US Dollar Index ETF) is trading higher in what appears to be a rising wedge formation. Rising wedges can be tricky because sometimes they are simply a modified uptrend and not necessarily a weakening that leads to a quick price drop.
So either the UUP is going to blast higher from here which would put it in a stance to exceed the key swing high of 23, OR the UUP will break down from this rising wedge and drop rapidly. So it is either A or B.
Now I could wait for confirmation before going with a BOT long or Short Signal but I figured I would go ahead and take the plunge now and try to anticipate the next big breakout move (or break down move).
The NYSE summation index is curling over and the daily and monthly trend appears to be ready for more downside.
If the UUP breaks down from this rising wedge then it should be clear very quickly that I am wrong with this BOT short signal.
However a blast upwards in the UUP should get the downside ball rolling again.
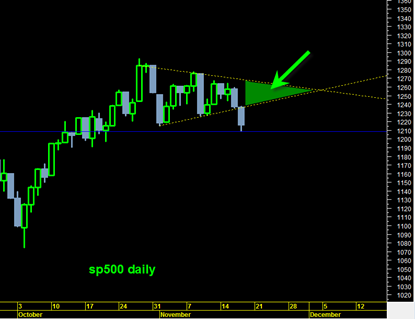
Note that the sp500 broke down out of the recent price compression and then touched the 1210 support range and sort of bounced off of it. The sp500 needs to get back into the green shaded area to keep the upward trend momentum going into end November 2011.
The triangle formation that appears in the chart above could also be said to now be forming an alternative ‘falling flag’ formation, or simply a rectangle formation.
So in summary and to keep it simple. The sp500 needs to hold 1200 (nice round number) and the UUP needs to fall down out of the possible rising wedge for the bullish bias to maintain in the sp500.
If the opposite occurs, then it would appear we could be in for a new bear trend leg down in the weeks (months) ahead.


