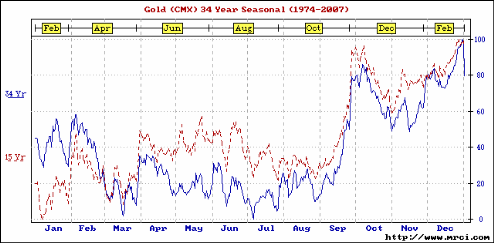
In case you have not seen it yet, the above chart is the 34 year seasonal chart of Gold from MRCI. You can see clearly from this chart that after a final low at the end of August (which is only 14 trading days away from today), gold enters a very strong seasonal tendency that kicks off during the month of September and then carries through towards end of December.
To be sure, this chart does not guarantee a huge move in September, but it does say that the probabilities are highest for such a move during that month.
Could it be that the gold price is going to go into a final low during the next 14 trading days? I don’t know, but I do know that the next month and a half are likely to be very interesting months for the gold sector.
