The bull case and bear case is never really totally clear unless you branch out to the much longer time frames.
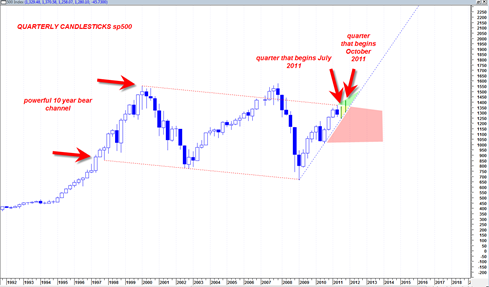
Based on the quarterly sp500 chart I can only make the conclusion that the market is still in a potential zone for more bearishness and also in a potential zone for more bullishness. You will understand what I mean when you look at the chart below.
The fact is that the sp500 has been trading in a 10+ year long trading channel sideways in nature with a slight downward slope. There are two more quarters for trading in 2011 and if you look at the chart below you will see that as long as the two trading quarters are still supported by the dotted blue up trend line, then the market is on track for a massive 10 year channel break out.
The two green horizontal bar in the chart above are where the next two trading quarters will be. Both of these quarters could still trade within the overall uptrend since March of 2009. OR one of them could start to break down below the blue dotted trend line.
The July trading quarter will start at the end of this week. So even if you are very bearish right now on the market, the chart above should make you pause for moment and realize that the market has technically not really broken bull market trend yet and that it still has the open option to align with trend again and then bust out north from this massive channel creating a massive decade long channel breakout !!!
The red shaded area is the danger bearish zone. This zone may be entered in the September October 2011 time frame but there is not enough clarity on that yet.

