The relative strength of silver futures relative to gold is quite amazing to watch in recent months. The current tape action of silver futures and the silver ETF is almost better than textbook type price action. Up days are much more frequent than down days, and when an occasional down day does occur it is often in the form of a constructive candlestick formation. The up day price bars how a persistent replenishing demand for silver and show that strong hands are in control.
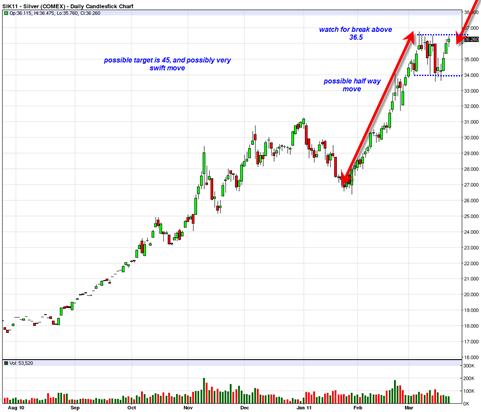
From March 7 to March 15, 2011, silver futures took a bit of a hit which was in tandem with the sp500 ‘Japan earthquake’ correction. But now during the recent 3 trading days we see that silver futures have bounced right back up to near the 52 week high range almost instantly like a powerful spring. Silver has basically said if it had a voice, “I don’t feel like correcting now and will strongly reject the 33.5 range and try the other side”. The other side in this case is 36.50.
Both Silver and Gold have been great early indicators or sensitivity indicators to look towards when trying to gauge the potential for how serious a broad market correction will be. If you see gold and silver very reluctant to give back ground during an sp500 correction, then it could imply the stock market correction will be limited. This appears to be the case right now.
It looks like the other side is going to be busted in short order to the upside which could even further accelerate a parabolic move for silver towards the 45 to 50 range. This could be a very fast move if silver is able to successfully break above 36 with conviction. If we look at the move that started in late January 2011 and then measure up to the recent minor correction, it could imply that the recent correction is serving as a pausing point and half way move point for a follow on move of about 9 dollars which would target the 45 range as a target. If correct, then this 45 range target could come quite quickly. As I alluded to several times before, the metals are moving into parabolic mode which means faster moves with possible multiple unfilled continuation gaps to the upside.
Yesterday I did a post on the US Dollar Index long term chart and clearly that could help a parabolic continuation move in Silver Futures the next few weeks.
There have been some pro traders who have been talking about the commodity complex doing a major major top right now and that they have completed major Fibonacci patterns. But when I look at the tape action in Silver I just do not see an imminent crash or panic. The tape looks very strong. I do not see any rolling top in silver, three drives to a top, or other indicator of major weakness. Silver looks like a monster right now, has done a short small consolidation and could go parabolic to 45 dollars if we get a few more closes over 36.
Having said that, a breakout is not a breakout until it actually occurs. Anytime time we see commodities such as silver or gold trade near the top of a trading range there is always risk of selling pressure and move back down to the other side. But for now I do not see any sign of that and on the contrary see extreme strength and think we should bust out quite soon north.
The daily MACD histogram initiated and confirmed a buy signal yesterday in Silver Futures.
As indicated yesterday, perhaps the market and commodities are waiting for the GDP this Friday. If it comes out strong again, then maybe that is the green light the markets are waiting for, including also gold and silver.
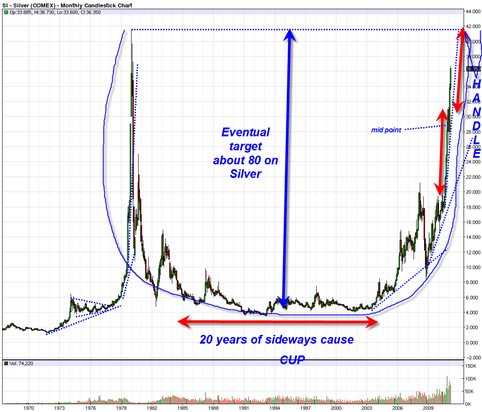
The very long term chart of silver futures shows that the 41 to 42 range could be a potential stopping point or correction point for this metal. It should be noted though that I cannot verify what the exact old spike high was in 1980. It may have been closer to 50.
But when we look at the long term chart one can clearly see that the recent move has a half way point that measures towards a move near 41 to 42 range as a possible stopping point.
My take now however is that when the correction finally does come (either near 41 to 42 range, or near the 45 to 50 range) it will be a consolidation correction that will serve as a possible massive HANDLE of a MASSIVE MASSIVE cup and handle pattern.
The massive cup and handle pattern has potential measurement near the 80 range for silver. But first a big handle needs to be created. This handle upon completion will probably offer a superb long opportunity in silver futures and the Silver ETF.
Clearly, the massive cup and handle pattern is very much a long term theme. In the mean time lets see how silver futures are able to bust north of 36 or not this week. . .


Cup and Handle…very cute picture!
Thanks for the silver analysis update.
I believe Silver intra all time high was $51 30 years ago.
Well here we are at $41
Other experts are calling as high as $60 by end of June.
Are you projecting $80 ?
I think we could see at least 80 eventually but now after this crash it will take SLV a long time to build up its courage again, it may take as long as October before things start heating up again in my opinion..