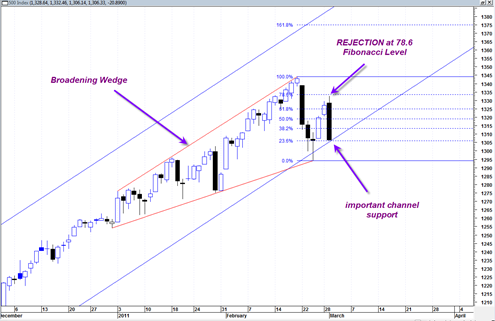
The sp500 today was rejected very severely at the 78.6 Fibonacci retracement level almost to the exact tick. Also notably today we bearishly engulfed the previous two days price action and closed right at the lows. Sometimes this type of action is ending action, but in this case it looks more to me like confirmation of a more intermediate term bearish type trend.
Also important to note is that today the sp500 closed right on the lower boundary of the rising channel I have been referring to for quite some time now. If this channel fails to hold this week, it will be further confirmation that we are in a more important correction now.
The sp500 also appears to be trading within a large broadening wedge formation which has the potential at least to be quite a bearish pattern with strong bearish resolution. The bottom support of this broadening wedge is 1299 according to my chart. That could mean that if we continue down tomorrow, 1299 could be a reversal zone or short term upside reaction zone.
The 5 and 10 day moving average of the NYSE summation index is in a bearish crossover stance and should help the market continue its current weakness.
Closing ARMS index today was 2.58 according to stockcharts dot com which could warn of some type of upside reactionary bounce tomorrow and then perhaps a late day or end of day sell off near channel support again.
All signs point to this long term up channel being broken soon, but it is also important to get a close lower than the reversal candlestick hammer of 2/24/2011. Technically, despite the recent bearish action we are still in a scenario of ‘higher lows’ as one looks along the lower red line boundary of the broadening wedge.
So again 1299, and today’s low in the sp500 appear to be the most important levels to watch for the rest of this week…


Dont waste your time with this you will lose all your money guaranteed
get ready to buy nat gas etf at 5.80 and pyramid to 10.00 yes thats correct