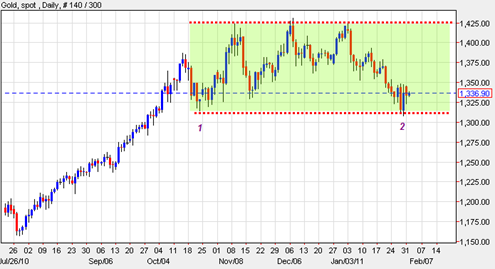
The spot gold price is still holding above the 1314 support range despite the recent days violent volatility that kept traders guessing if we would get a support range break down or confirmation of holding support.
I suspect a lot of sell stops have been triggered at the bottom of the range near 1314 level and now after today’s minor pullback the spot gold price may be in a stance where it can swing back topside to the top boundary of the current channel range.
The daily MACD is starting to curl up and could indicate that turn up is coming as soon as this week. The 8 hour price chart of the spot gold price is showing a possible head and shoulders bottoming formation with a potential target into the 1370 range. I view 1314 as must hold support this week and preferably a jump higher above 1345 this week to confirm a successful test of the bottom of the trading channel.
The gold price has been ‘temperamental’ really since mid October 2010 which is a respectable length of time for new cause building. Ideally for the bulls the cause building will continue in this range and then resume higher later this year.
The move up since August of 2010 was a very persistent move in the gold market and needed some consolidation. Now we are about 3 months into the consolidation and it will be interesting to see how this trading range plays out. If the gold price is still in its strongest and truest form, then we could see 1314 be the maximum down for the year 2011.
My sense is still that despite the enormous surge in the gold price, we have not seen the true parabolic in this market yet that gets everyone on board. Gold still seems like it is somewhat of an afterthought instead of an obsession.
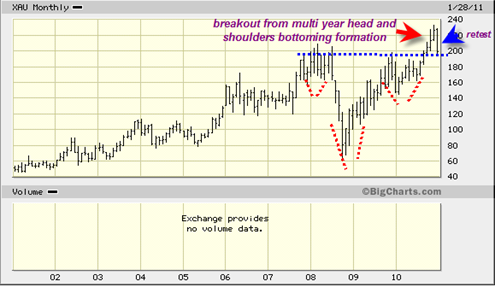
Looking quickly at the 10 year XAU gold mining stock index monthly chart we see that this gold mining stock index has successfully broken out north with a sign of strength through the neckline of a multi year head and shoulders bottoming formation.
During the most recently completed month (January 2011) we also see that the XAU has sold off to retest this 3 year supporting neckline. Retests back to neckline formations of multiple years can be ideal low risk entry points. So it would appear that the XAU has a lot higher to go and suggests that the current corrective gold price trend is simply that, a pause in the longer term uptrend.
As long as 200 range on the XAU holds firmly, then we can say that the XAU had a valid breakout, then a retest and then a possible new continuation of the previous trend (up).


8, 20 and 50 MDA crossing over above price. This makes for a strong confluence of resistance for GLD to break through. But if it does manage to break through, perhaps triggered by an event in Egypt, it will make a powerful move upward.
Yes Gold seems like it could be preparing for a mega blow off run.. but needs to climb back to top of trading range as a first step.. nice action today to get it started…