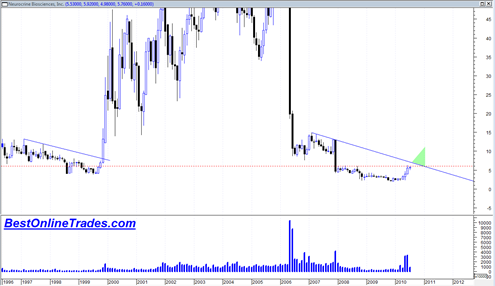
Like a cheetah in the tall African grasses, I have been watching NBIX Neurocrine Biosciences, Inc for several weeks now. This biotech stock first caught my eye as I was scanning through the sector lists in the category biotech stocks. I was looking at each each stock in this sector one by one (there were at least 100 of them) and I came upon NBIX.
Biotech stocks have this tendency (especially the small ones) to be extremely volatile both up and down because typically they do not have substantial earnings and tend to trade based on milestones as it relates to the drug candidates they are advancing. FDA approval or disapproval can mean the difference between a 100% up move or a 90% down move sometimes in just one day.
Having said that I still like the longer term chart of Neurocrine Biosciences, Inc NBIX because it seems to be telling an interesting story chart wise. Every stock always has some kind of story to it in terms of what the chart is telling us. Some stories are really boring and don’t seem to indicate anything. Others are much more interesting and have well defined levels and indications that something big is about to happen.
Neurocrine Biosciences, Inc, on the monthly and weekly charts looks very constructive to me.
I like the fact that this stock since the May, 6, 2010 flash crash in the general market has trended sharply higher on very strong momentum while the rest of the market was dropping like a rock.
I also like the very strong volumes off of this base as a contrast to the very light volumes that defined the bear market lows in the stock during 2009.
Right now NBIX is perched right under a 2 year resistance level. If it can get over 6.23 and stay above there it would be on new support at roughly the 6 level and then set the stage for a third attack at a 3 and half year down trend line near the 7.30 level.
If NBIX can then break and stay above 7.60 it would suggest a longer term breakout and a possible strong momentum run much higher into end 2010 and maybe 2011.
Until it breaks above 7.60 and is sustained above that level there is still risk it can fail and break back down along its long term down trending force. Assuming a break of 7.60 or higher is achieved, then a stop right under that long term resistance line would make for a nice risk /reward setup.
My charts are saying that it will be able to break into the 7.60 and higher level in the months ahead but for now it is still in somewhat of a congestion zone.
You can see on the chart that before the year 2000 a similar dynamic was taking place and the successful break of long term resistance led to a huge upside move. Of course that was in part related to the dot com bubble era.


If the trend upwards were to break. What would you consider support below. 1st level, 2nd??
Great article, Thanks,
Steve
I am not sure I understand your question. Right now it has minor support at 5 but we just bounced off of that. Not sure if it will be tested again.