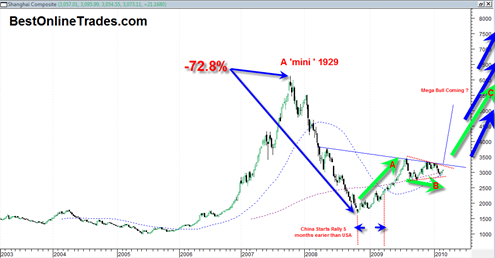
I have been keeping the China Shanghai Composite Index in my index of charts for quite some time now because I felt it was a very important leading indicator and generally good index to look at from a long term perspective.
Now here are the three important facts I wanted to bring to your attention regarding the Shanghai Composite index:
- During the 2007 to 2008 period, the Shanghai Composite Index went through a MASSIVE almost 73% decline which almost puts it on par with the great 1929 decline of 90%.
- The Shanghai Composite started recovering 4 to 5 months before the SP500 recovery got underway. So in a sense the Shanghai Composite led the recovery, although admittedly from a more severe 73% decline as opposed to the almost 50% decline in the sp500.
- The Shanghai Composite could be near the final stages of developing a MASSIVE head and shoulders bottoming formation which could soon send it into orbit in 2010-2011 time frame and perhaps eventually to the old record highs.
I am very bullish on China and Chinese Stocks and the China economy in general. If we get a bullish breakout from the chart above then the chart is going to agree with the economics. That a massive phase of expansion is going to take place in China during the next few years.
The interesting thing about this chart is that it almost looks like the 1929 period where after the decline ended in 1933 the market recovered, then formed a base and then shot higher very persistently for quite some time.
But there is still plenty of work to do on this index.
Now the question is how the behavior of this index is going to relate to the what the US indices do. I suspect that the US indices will follow the leader in bullish fashion but I still think it remains an open question whether the US markets can mirror the performance of China. I doubt it.
What may happen is that the US markets still get a continued uptrend going but only as the ‘slow dog’ that underperforms.
Remember when the Japanese Nikkei was blasting higher in almost vertical peak fashion into 1989 time period? That was interesting because at that time the US market was generally quite sloppy. So it will be interesting to see if something similar happens going forward, that China takes the real lead and massive capital flows move proportionally out of the USA into asia and cause a similar divergence to what existed between Japan and USA during later 1980’s.
But I suppose one cannot rule out once again all markets moving up in one grand orchestra again… We may know the answer to that question by second half of 2010.
So in summary, I suggest contemplating the massive Shanghai Composite index head and shoulders bottom formation (although not yet confirmed) because it has potentially very bullish implications. And if it realizes it potential, it would seem to fully negate the longer term bearish deflationary scenarios I am sure you have heard (ie. breaking the March lows and moving into new persistent downtrends).

