In case you do not know about it yet, I would like to tell you about what I believe to be the most powerful cycle model ever created. I did not create it. It was created by a man named Marty Armstrong who headed the former Princeton Economics Institute which was an institutional advisory and money management firm. PEI as it was known has since been shut down by the United States government for reasons I can’t speak to because I don’t know the details or facts about them. But I will say that it is a crying shame that their business and knowledge was shut down because it was in my opinion some of the most valuable and important financial knowledge ever devised.
The former website itself used to have unbelievable amounts of historical research on money and financial panics going back hundreds and even thousands of years. The only reason I know about it is through a radio program that used to play in California and was hosted by Buzz Schwartz, a trader and radio host. He used to have Marty on as a guest and I listened to their interviews and his advice on markets. I also got a few of Marty’s monthly ‘Capital Market Review’ publications and that is how I am able to tell you about his cycle model.
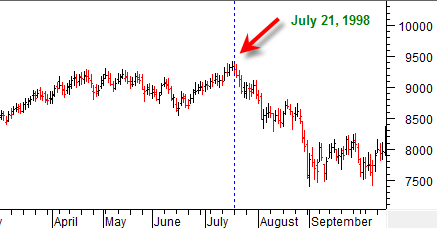
The reason why I believe it is the most powerful cycle model ever created is because I have seen it pick turning point dates in real time and on a few occasions be very precise. For example, do you remember the Asian currency crisis in 1998? The model picked that top in the Dow precisely to the day, July 21st 1998. It came close to being down 2000 Dow points a month and a half later.

It was also very close to picking the top in the Japanese Nikkei on December 14th, 1989. That top in the Nikkei was a truly historic top. It is now coming close to being a 20 year peak and perhaps not to be reached again for another 10 or 20 years. So Marty’s cycle model does not just apply to USA markets. It applies to all markets and from my understanding should be considered within the context of global capital market flows, not just one country. It was also able to pick another important top, the 9/13/2000 major major top in the SP500.
The most recent cycle date was April 21st, 2009, which was an intermediate cycle point between the 8.6 year major cycles. The US Dollar index turned down precisely on this date and so far has not managed to gain enough footing for a break of down trend. Could it be that the US Dollar index on April 21st, 2009 has activated a renewed bear market into the next June 14th, 2011 date? I can’t tell you the answer to that, but I do find it curious the US dollar made a peak on that date and has since had a pretty severe breakdown.
The best way to interpret the dates on the model are as turning points. What I recommend is that you keep an eye on most major markets and indices as we come close to a turning point. The turning points do not come around that often. It is definitely more of a long term exercise. However, I think everyone, from beginning traders to hedge fund managers and seasoned stock pros should have a copy of this ‘cheat sheet’ cycle model on their desk as long term reference point for possible MAJOR market trend changes. The cycle model becomes more useful when you combine it with your traditional timing indicators and overall analysis.
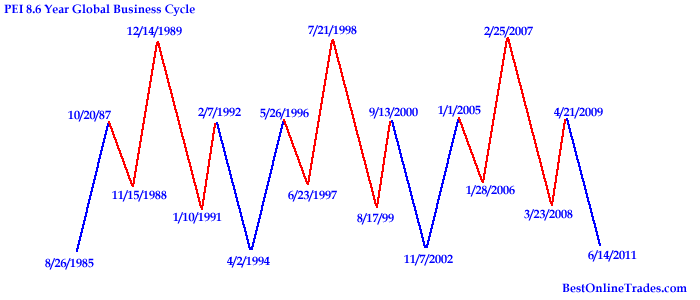
The cycle model is divided into major 8.6 year cycles (these are the big ones) and then intermittent 1.075 and 2.15 year cycles.
The drawing above shows all the 8.6 year and intermittent dates above between the years 1985 and 2011. The major 8.6 year turning points are along the bottom and top and all the intermittent dates are in between. I believe that the bottom 8.6 year dates are guided to be possible important lows and the top 8.6 years dates possible important tops. That is how this portion of the model has aligned itself according to various markets from my own observations. However I cannot rule out that some of the dates along the bottom can be highs turning points in certain markets.
The next major turning point date is on 6/14/2011. I have no idea what market could possibly align with the model on that date. We will just have to make some close observations at that time to see what we can find. Of course I will combine it with all my other regular timing work.
I gotta tell you, I find it very interesting how close the 6/14/2011 date is to the Maya Cosmogenesis 2012 date. It says to me that we could get a very important possible turning point, but I can’t speak to which market it would be at this time. Maybe gold, maybe US Indices?, or China? I believe the Maya Cosmogenisis date is in November 2012. The Maya Cosmogenesis date is the end date of a 16.7 billion year Mayan calendar. It remains to be seen whether this date can show either a major low or high for any market, but it will be interesting to see the closer we get to that date.
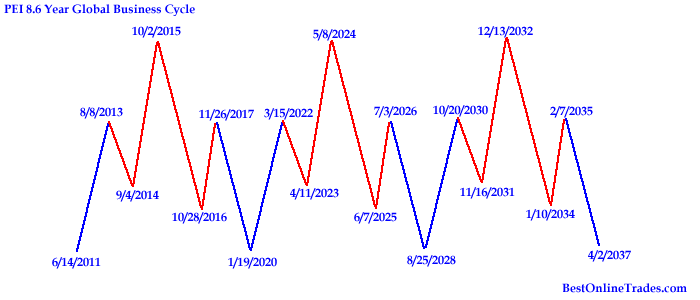
I have transcribed the second major grouping of dates on this cycle model below.

You can see that this portion of the cycle model extends from 2011 to 2037, quite a long time! And plenty of time and turnings points to keep track of.
I have found that the cycle model dates can potentially become much more useful when you see aggressive price trends into a turning point date. The longer the price has been moving in a particular direction, or the more over extended it is, the potentially more valuable and relevant a turning point date may become.
So that is my brief overview of the Marty Armstrong PEI cycle model. I will be talking about this more in the future when we come close to the important dates, but don’t wait on the edge of your seat because we are talking major long term here.

