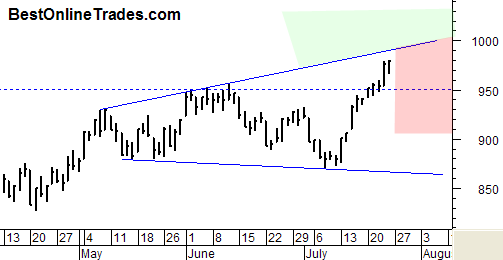
The SP500 had a clear valid breakout yesterday on confirmed volume according to the numbers that I look at. Yesterday was a ‘sign of strength’ and it was what we needed to see to make this a valid breakout above the 950 level.
I can tell you flat out that one of the most common pieces of price action I have seen over the years which happens almost with spot on regularity is the retracement of price right back to the breakout level. In the case of the SP500 that would be near the 950 level. So if we can get a retracement back to that area on low or weak volume it would be an ideal scenario of going long as long as that support holds.
The other aspect to this chart of the SP500 is that it may be tending towards a broadening formation. Trader Mike is the one who first observed that and so I am borrowing that pattern identification from him. Broadening wedges are continuation patterns and so assuming this is actually one of them, I would expect the SP500 to eventually be able to resolve to the upside.
So for next week I see the following scenarios:
- The SP500 bumps its’ head on the top portion of that broadening formation and hesitates at that level only to break down from that level later in the week into the red shaded area.
- The SP500 touches the top part of the broadening formation hesitates only slightly and then blasts through in breakout formation into the green shaded area.
- Right from the early part of next week the SP500 starts retracing back to the breakout level of 950
So there you have it the whole market summed up in 3 bullet points.
I would like to initiate a long for the BestOnlineTrades Recommended List somewhere within this range. The TNA which is the Russell 3X bullish ETF seems ideal so the question is where to initiate it? The big rally we have had so far seems to make it a high risk entry at this point. So IDEALLY, a pullback to 950 on the SP500 would be a first chance. OR, if the SP500 manages to push into that green shaded area, that would be a good place to go and stay long but only as long as price holds that green shaded area.
This is really tricky up here. To be honest, going into August here shortly is not the best time frame for any kind of setup. Amazingly the market is pushing higher into this time frame.
Seasonally one would expect some sort of double dip down into September, October and then powering higher.. but we will just have to see.
The worst case scenario based on the above chart is a failure upon hitting the top trendline. Then a reversal back down to support. Then a failure of support and a move back down to the lower part of the pattern. This scenario is no where near activating however. The first main guidepost is the 950 area of support, OR a topside breakout out of this pattern.
