This is a very important alert on the uranium sector, it is starting to look like the uranium price has bottomed and that the uranium mining stocks are set for a pretty good rally for the second half of the year.
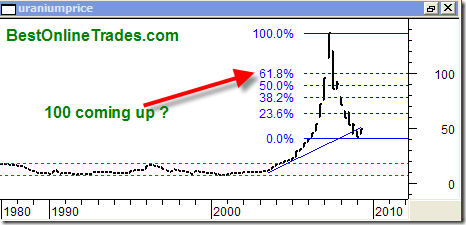
Do you remember the huge rally we saw in the price of Uranium from January 2001 until June 2007 ? It was an absolutely HUGE rally, one of the most amazing rallies I have ever seen in my life, or at least since I started following markets in 1994. Maybe some of you have seen better rallies than this one, but for me it was one for the record books.
Uranium Shot up 1842% from 2001 to 2007 !
How many other commodities do you know of that had such a huge run since 2001 ? I don’t know of any others. Crude oil has a pretty good run and soybeans did too. But I don’t think anything else compares to how bullish a run that was in the Uranium price. So it is pretty clear that the entire run in the uranium price was from 2001 to 2007 was a clear sign of strength. The market was trying to tell us something and I think quite a few got the point. But now what?
Since the peak at about 140 per pound, the price of uranium crashed down to a low near the 42 area (That crash in price from 138 to 42 went a little bit past the 61% fibonacci retracement level of the entire rally that began in 2001), but since then it has been sort of basing around and I believe it has found support and will soon get legs for at least a reactionary 61% retracement of the decline that began at the 138 level. If it does that then it would put the uranium price back near the 100 level. Whether or not uranium is able to go higher than that is not a concern to me for right now. Lets focus in on the near term and see if a strong reactionary upside bounce to 100 can occur.

On the chart to the left you can see the uranium had a long trading range as defined by the red dotted lines from the period of 1987 to 2004. This was a very long period of sideways consolidation and in fact is one of my favorite type of patterns to spot. Why? Because a sideways consolidation that occurs for such a long period of time is indicative of a very large eventual upside move once demand is able to overtake supply.
I was not smart enough to call the breakout in the uranium price from this trading range in 2004, but Jim Dines was. What a great call. It just goes to show that some of the best trades in the world are the ones that no one cares about and that are quietly doing their thing in their trading ranges. Only the keen traders that are watching these basing ranges are able to capitalize on them when they notice that a change is at hand (ie. price breaks out of a long trading range). By the way the chart above shows quarterly closing prices, this is not the uranium futures contract, they are the monthly prices from the Ux Consulting Company, LLC and Cameco Corp.

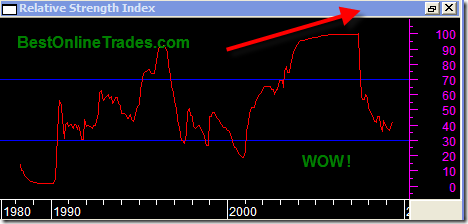
This RSI chart to the left is the 14 day RSI chart of the MONTLY uranium price. At the peak the RSI value reached 99.97, basically almost reaching 100 which is almost unbelievable !
Also from 2004 to April 2007 the monthly RSI held consistently ABOVE the 90 level. Also unbelievable !
I have never ever or at least very very rarely have I ever seen any stock or index behave so bullishly for such a long period of time. I mean heck normally I get concerned when RSI gets above the 80 level and start to get really nervous about holding on too long to whatever I happen to be in. But here we can clearly see that uranium broke all records and technical milestones and shot up like a rocket with almost zero selling pressure !
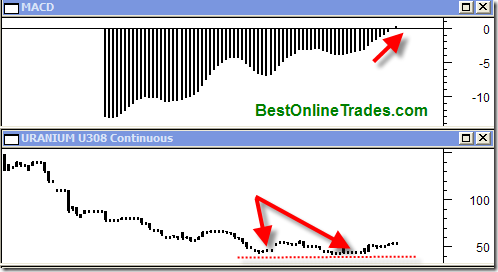
Finally this chart to the left is the continuous uranium futures contract with the weekly prices. It looks clear to me that we have almost completed a double bottom on this chart and the MACD signal line is confirming a buy signal for me now.
The uranium futures contract looks like it is extremely thinly traded with very low volumes and basically almost no liquidity to be found. But I bet there are a few smart traders that are accumulating this contract right now regardless of the bad liquidity issues.
So what if the Uranium Price is going up? Now what?
A handful of uranium stocks have had a good run from their lows of 2008 and early 2009. Many of them appear to be consolidating now in a sideways range but still the trend appears to be in the upward direction. I am not quite sure how they will behave in a deeper stock market correction but for now they look constructive to me.
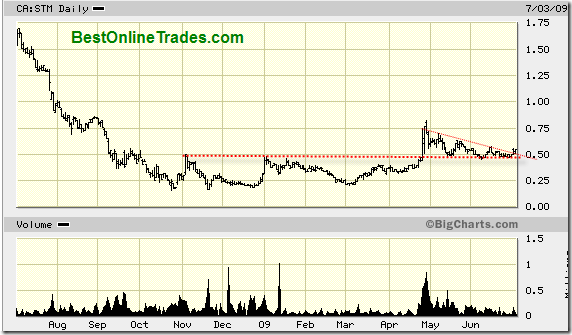
Cameco (CCJ) could come back down to support at 20 and be a good buy there. But I also like Strathmore Minerals which trades on the Canadian exchange (symbol STM). Strathmore looks like a good 6 month trend play as long as it holds above .50 cents going forward. It cannot break under .50 cents as that is an important area of support. But it has a nice pattern and combined with a nice bounce in the uranium price I am giving it good odds for a nice move up.
It has a nice base from November to mid April and then a very nice breakout and sign of strength with outstanding volume. So now it is perched above support at near the .50 level.
But again, it needs to hold above .50 and also more preferably needs to hold its breakout range from that red down slanting resistance line I have drawn. Gosh of all the contrarian plays out there uranium sure does seem to fit the bill. I mean who in the heck cares about uranium? Not too many people. But that spells opportunity. It has an absolutely unbelievable run before, so now I think act II is coming up. But we shall see.
I am giving STM a rating of 2 from 1 to 10 with 1 being the highest level of confidence.
I will try to revisit this sector down the road and see how things are cooking and whether I was correct or not.
Happy 4th of July weekend to all.
God Speed to you.


1 thought on “Uranium Futures are Turning BULLISH”